3rd Dimension
  • Welcome to 3rd Dimension Help
  • πŸš€Getting started
    • What's new
    • Installation
    • First start
    • Platform update
    • 3rd Dimension Beta
    • 3rd Dimension Account
    • 3rd Dimension Licenses
    • License Comparison
    • Backup & restore manager
    • Reset settings to default.
    • β€œCoinpayments” payment
    • Referral Program
  • βš™οΈGeneral Settings
    • 3rd Dimension Main Toolbar
    • Workspaces
    • Single Panel
    • Link panels
    • Binds
    • Group of panels
    • Templates
    • Set as Default
    • Symbols lookup
    • Table management
    • Alerts
    • General settings
    • Custom hotkeys
  • πŸ”—Connections
    • 3rd Market Cap
    • Connections manager
    • Connection to Binance
    • Connection to Bybit
    • Connection to OKX
    • Connection to Bitfnex
    • Connection to Kraken
    • Connection to Bitmex
    • Connection to HitBTC
    • Connection to Poloniex
  • πŸ’‘Analytics panels
    • Chart
      • Chart types
        • Tick chart
        • Time aggregation
        • Renko
        • Heiken Ashi
        • Kagi
        • Points & Figures
        • Range bars
        • Line break
      • Chart overlays
      • Technical indicators
        • Diversified Divergence (DivDiv)
        • Oscillators
          • Aroon Indicator
          • Moving Average Convergence/Divergence (MACD)
          • Awesome Oscillator
          • Accelerator Oscillator
          • %R Larry Williams
          • Momentum
          • Rate of Change
          • Relative Strength Index (RSI) Indicator
          • Commodity Channel Index (CCI)
        • Moving averages
          • Exponential Moving Average
          • Simple Moving Average Indicator
        • Volatility
          • Average True Range
          • Standard deviation
        • Trend
          • ZigZag
      • Volume analysis tools
      • Power Trades
      • Drawing tools
      • Volume Analysis Tools | Volume Profiles | Footprint chart | VWAP
        • Cluster chart
        • Volume profiles
        • Time statistics
        • Time histogram
        • Historical Time & Sales
    • Watchlist
    • Time & Sales
    • Price Statistic
    • DOM Surface
    • Option Analytics
  • πŸ’΅Trading panels
    • Order Entry
      • Order entry for Bybit
      • Order Types
      • Order placing strategies
        • Local SL/TP
    • DOM Trader
      • DOM Trader Columns
      • How to set up Dom for scalping
    • FX Cell
    • History Player
    • Trading simulator
    • Market depth
    • Copy Trading
    • Market Replay
    • Strategies manager
  • πŸ’ΌPortfolio panels
    • Positions
    • Working Orders
    • Trades
    • Synthetic Symbols
    • Historical Symbols
    • Orders History
  • πŸ“ŠInformation panels
    • Account info
    • Crypto balances
    • Symbol Info
    • Currencies Exposure
    • Event Log
    • RSS
    • Reports
  • πŸ“ŒMiscellaneous panels
    • History Exporter
    • Symbol Mapping Manager
    • Live Support
    • Market heat map
    • Stat matrix
    • Exchange times
    • Quote Board
    • Browser
    • Excel and RTD function
      • Changing RTD Throttle Interval in Excel
    • 3rd Dimension Telegram Bot
  • πŸ€–Strategies & Bots
    • TPA
    • SpiderGrid 2.0
    • Breakout Catcher Bot
    • Retracement Catcher Bot
    • DivScanner
    • Swing Divergence Integration
    • Whale Splash
    • Pumps Catcher
  • ⁉️FAQ
    • General Errors
Powered by GitBook
On this page
  1. Analytics panels
  2. Chart
  3. Volume Analysis Tools | Volume Profiles | Footprint chart | VWAP

Time histogram

PreviousTime statisticsNextHistorical Time & Sales

Time Histogram is similar to tool that shows volume data as a vertical histogram for each bar. But unlike Time statistics, it allows you to visually evaluate the data for each bar, not only by colors but also by the shape of the histogram.
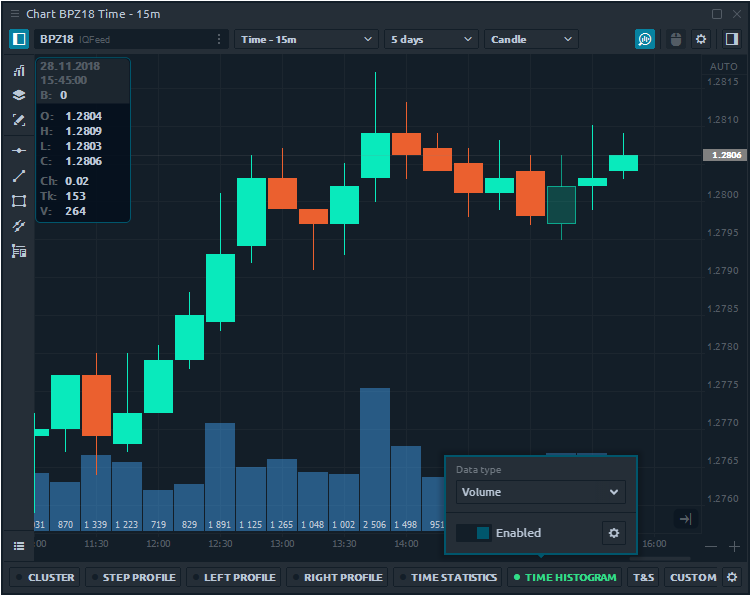
Click on the Time Histogram and switch the button "Enable" to activate the functionality on the chart. Time Histogram supports an extensive list of Data types that you can change either in the settings or directly in the activation mode.
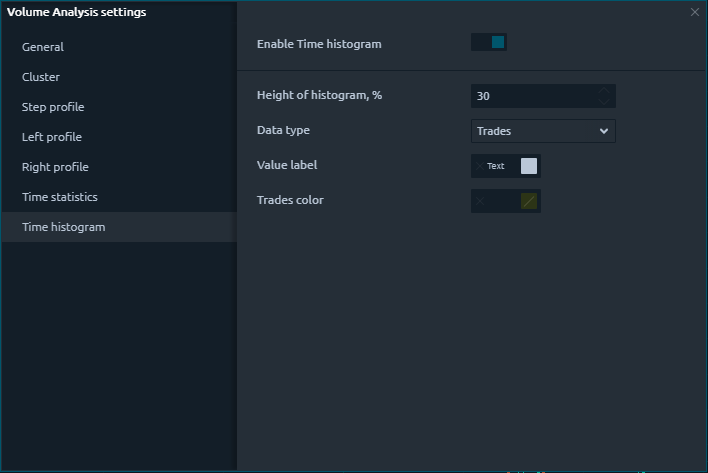
Enable Time Histogram β€” activates the functionality to display on the chart. After you activate it, the loading process of tick and volume data will begin. The yellow color will indicate that data is loading. Green color means that the data for the selected history depth is fully downloaded.

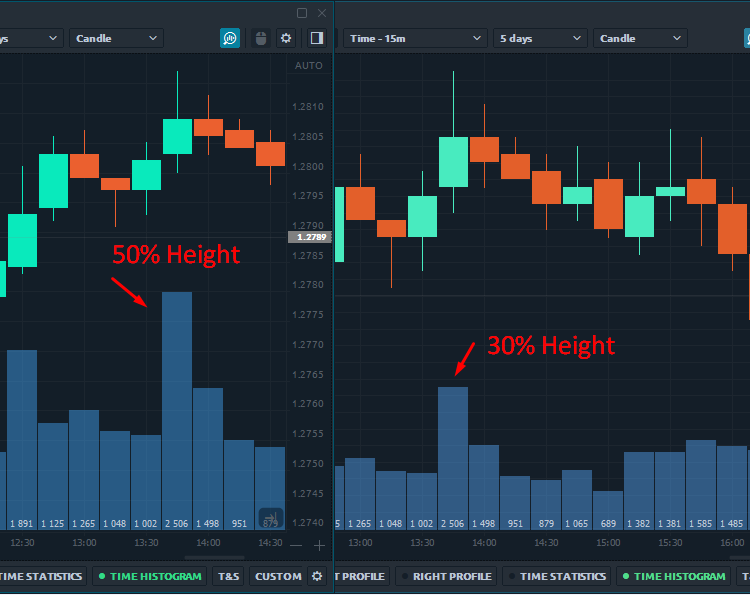
Height of Histogram, % β€” determines what part of the chart area will be occupied for displaying volume data. If you set the value to 50%, then half of the chart area will be filled by Time Histogram data.
  • Value label and Data type color β€” here you set the color settings for the font and the histogram, respectively.

The main Data Types for Time Histogram:

  • Trades β€” it's the number of contracts (trades) that executed at each price level.

  • Buy (or Sell) trades β€” it's the number of Buy (or Sell) trades that executed at each price level.

  • Volume β€” the total size of all positions that executed at each price level or price range.

  • Buy (or Sell) Volume β€” the total size of all Buy (or sell) positions that executed at each price level or price range.

  • Buy (or Sell) Volume, % β€” shows how many percent of the total volume relates to Buy (or Sell) trades

  • Delta and Delta % β€” shows the difference in traded Volume between Buyers and Sellers. It allows evaluating who controls the price on the market at a given time. Delta % = Delta / Volume * 100

  • Cumulative Delta β€” the data is built by adding the current delta value with each subsequent delta value for the certain period of time (or number of bars).

  • Average size β€” the average volume of the position that was executed at a certain price or price range.

  • Average Buy size β€” the average volume of a Buy position that was executed at a specific price or price range.

  • Average Sell size β€” the average volume of a Sell position that was executed at a specific price or price range.

  • Max one trade volume (value and %) β€” shows the maximum volume of a single trade that has executed at a certain price or price range (depending on the Custom Step (ticks) setting).

  • Filtered volume (value and %) β€” this parameter displays volumes that exceed the size specified in the filter. If the volume size is smaller than the one specified in the filter, then the values will be zero.

  • Buy (or Sell) filtered volume β€” the parameter displays Buy (or Sell) volumes that exceed the size specified in the filter.

Data types β€” various types of volume data that can be displayed on a chart. There are trades, volume, bid & ask trades and volume, filtered data, etc. The full list with descriptions of these data types you can find in our Help documentation that describes general information about .

πŸ’‘
Volume Analysis Tools
Time Statistics
Time histogram on the chart β€” general view
Main settings of Time Histogram tool
Loaded data (green color); data is loading (yellow color)
Set the height of time histogram (%) that will fill the chart area