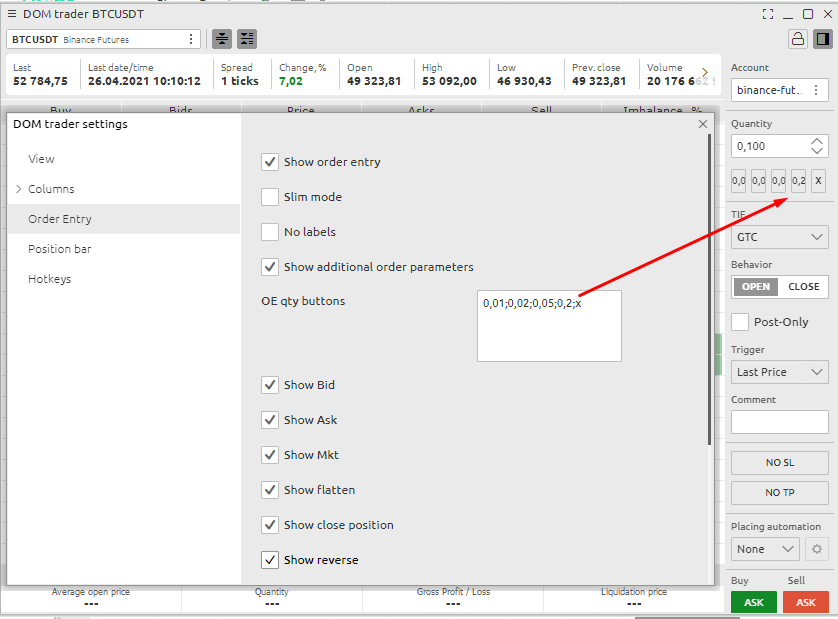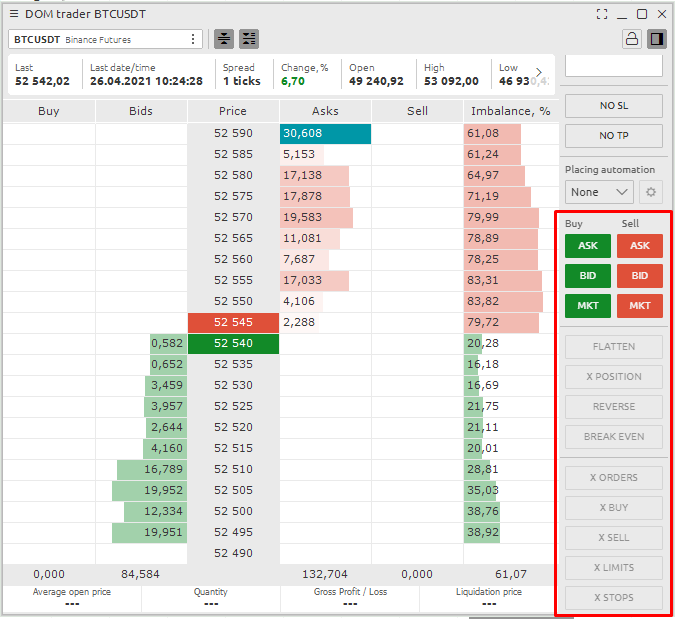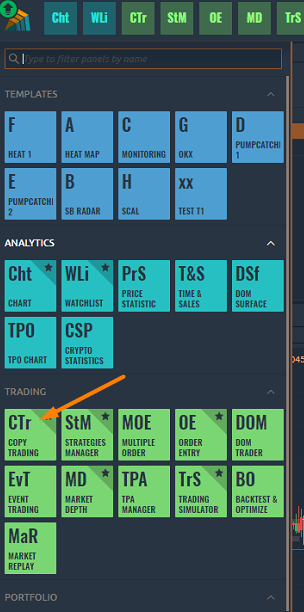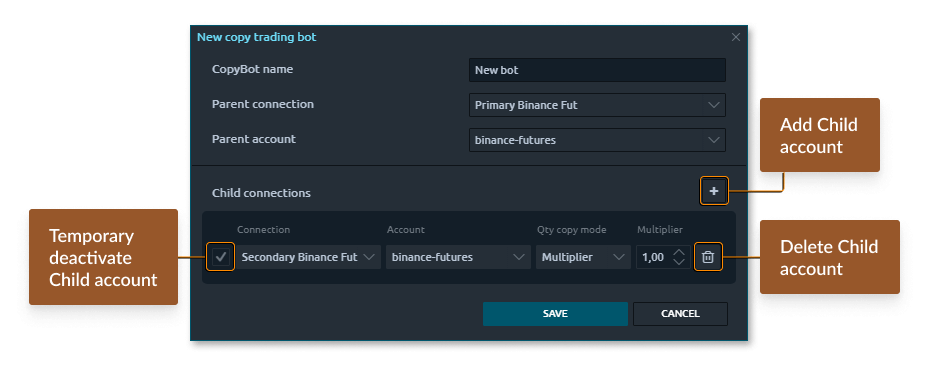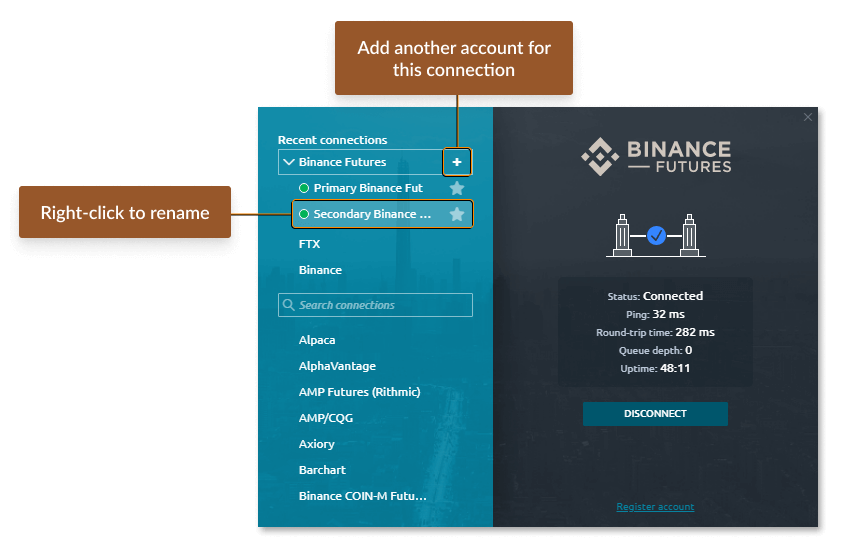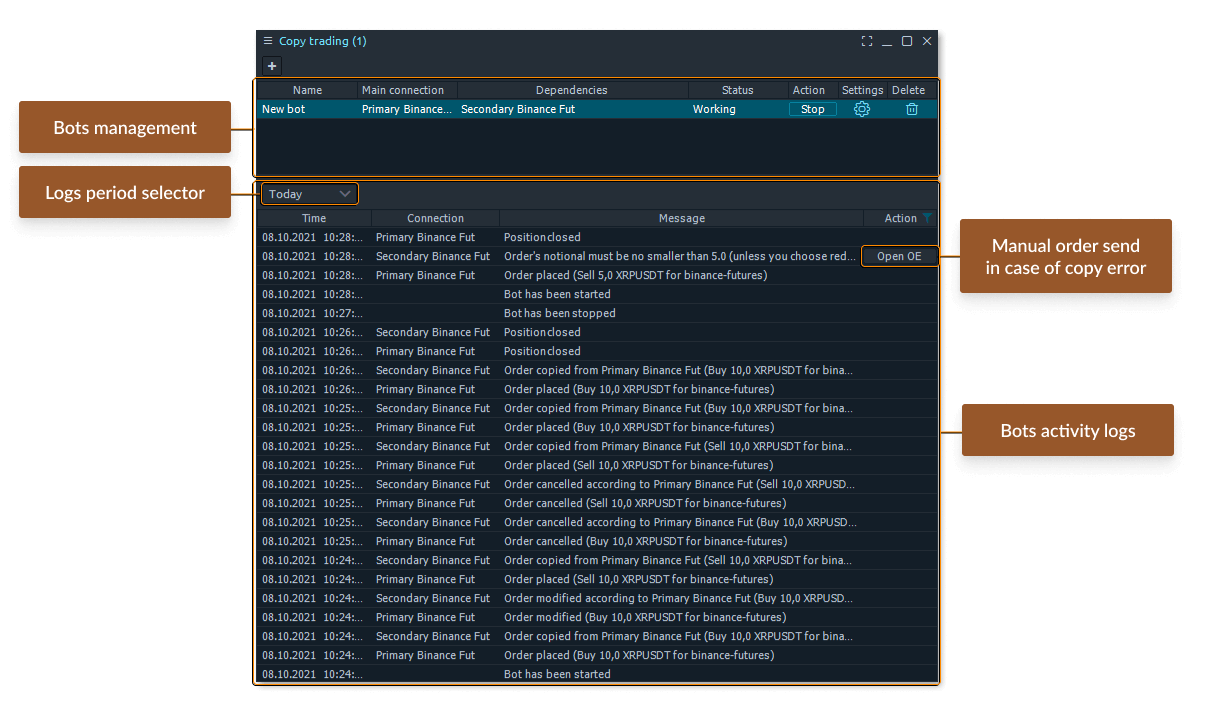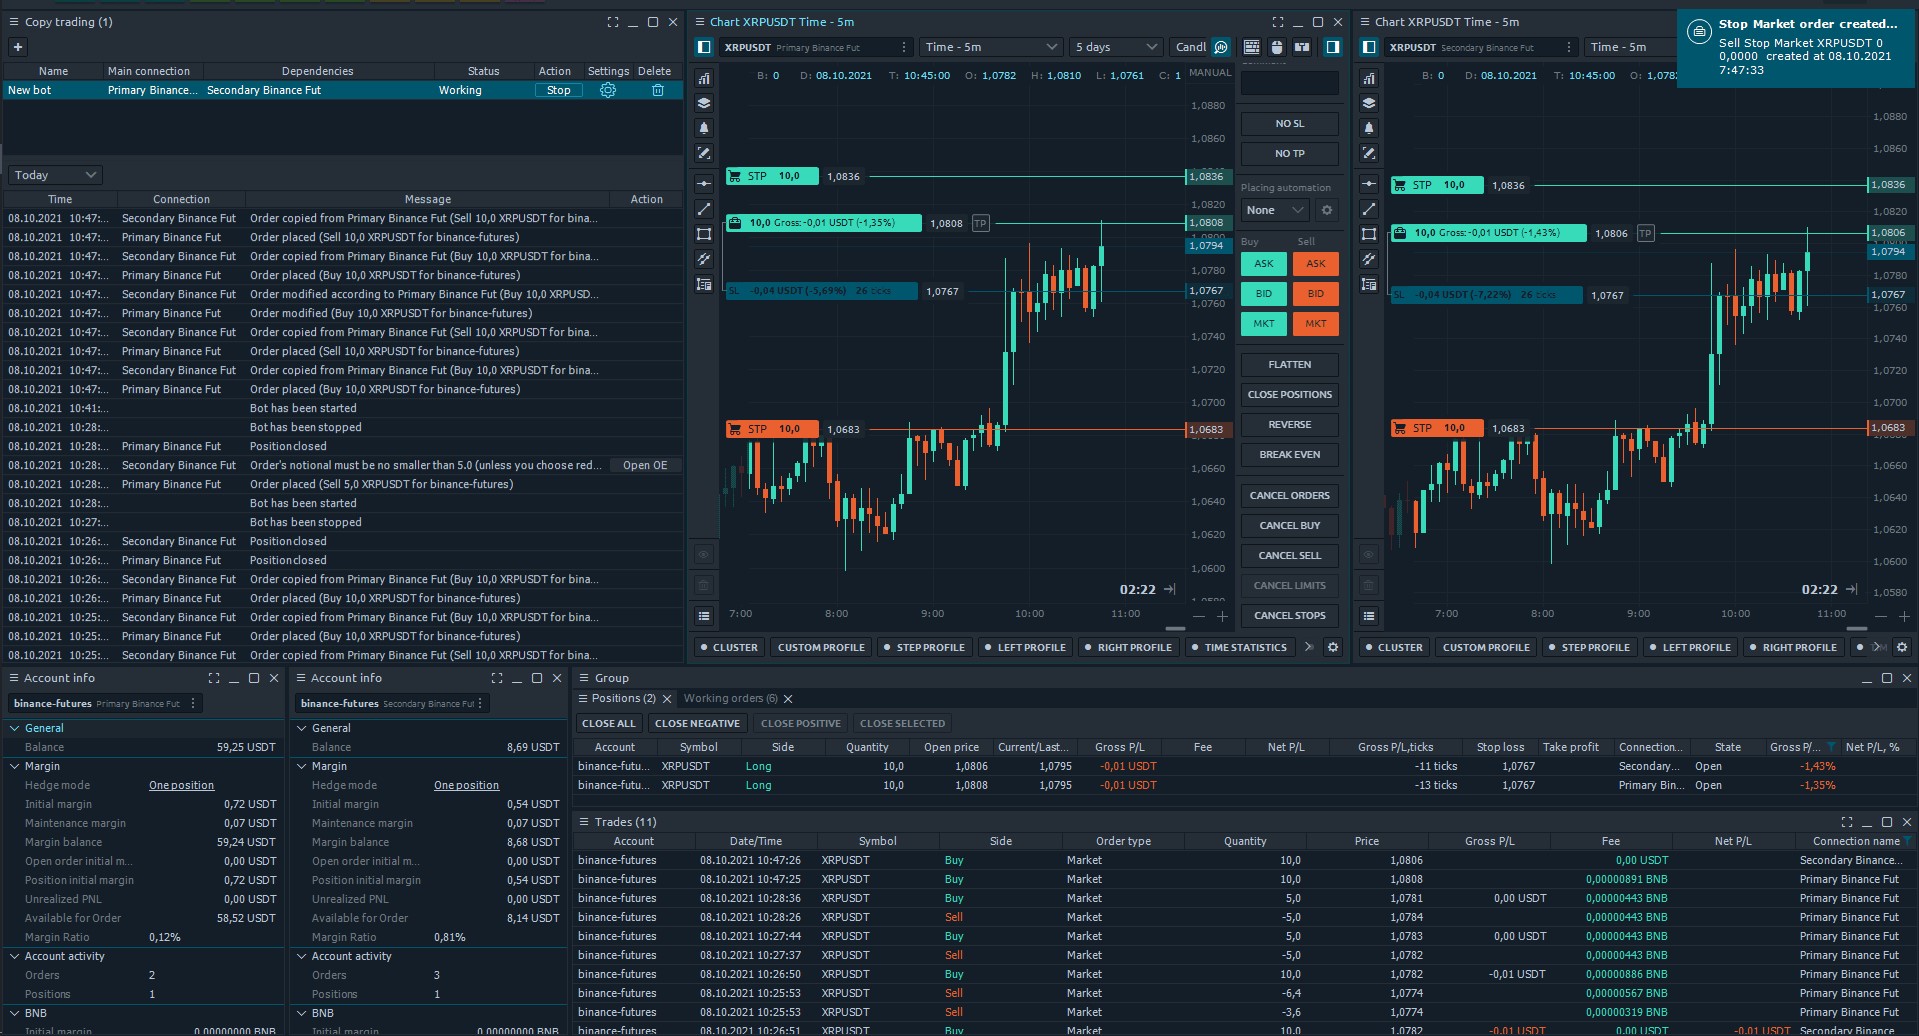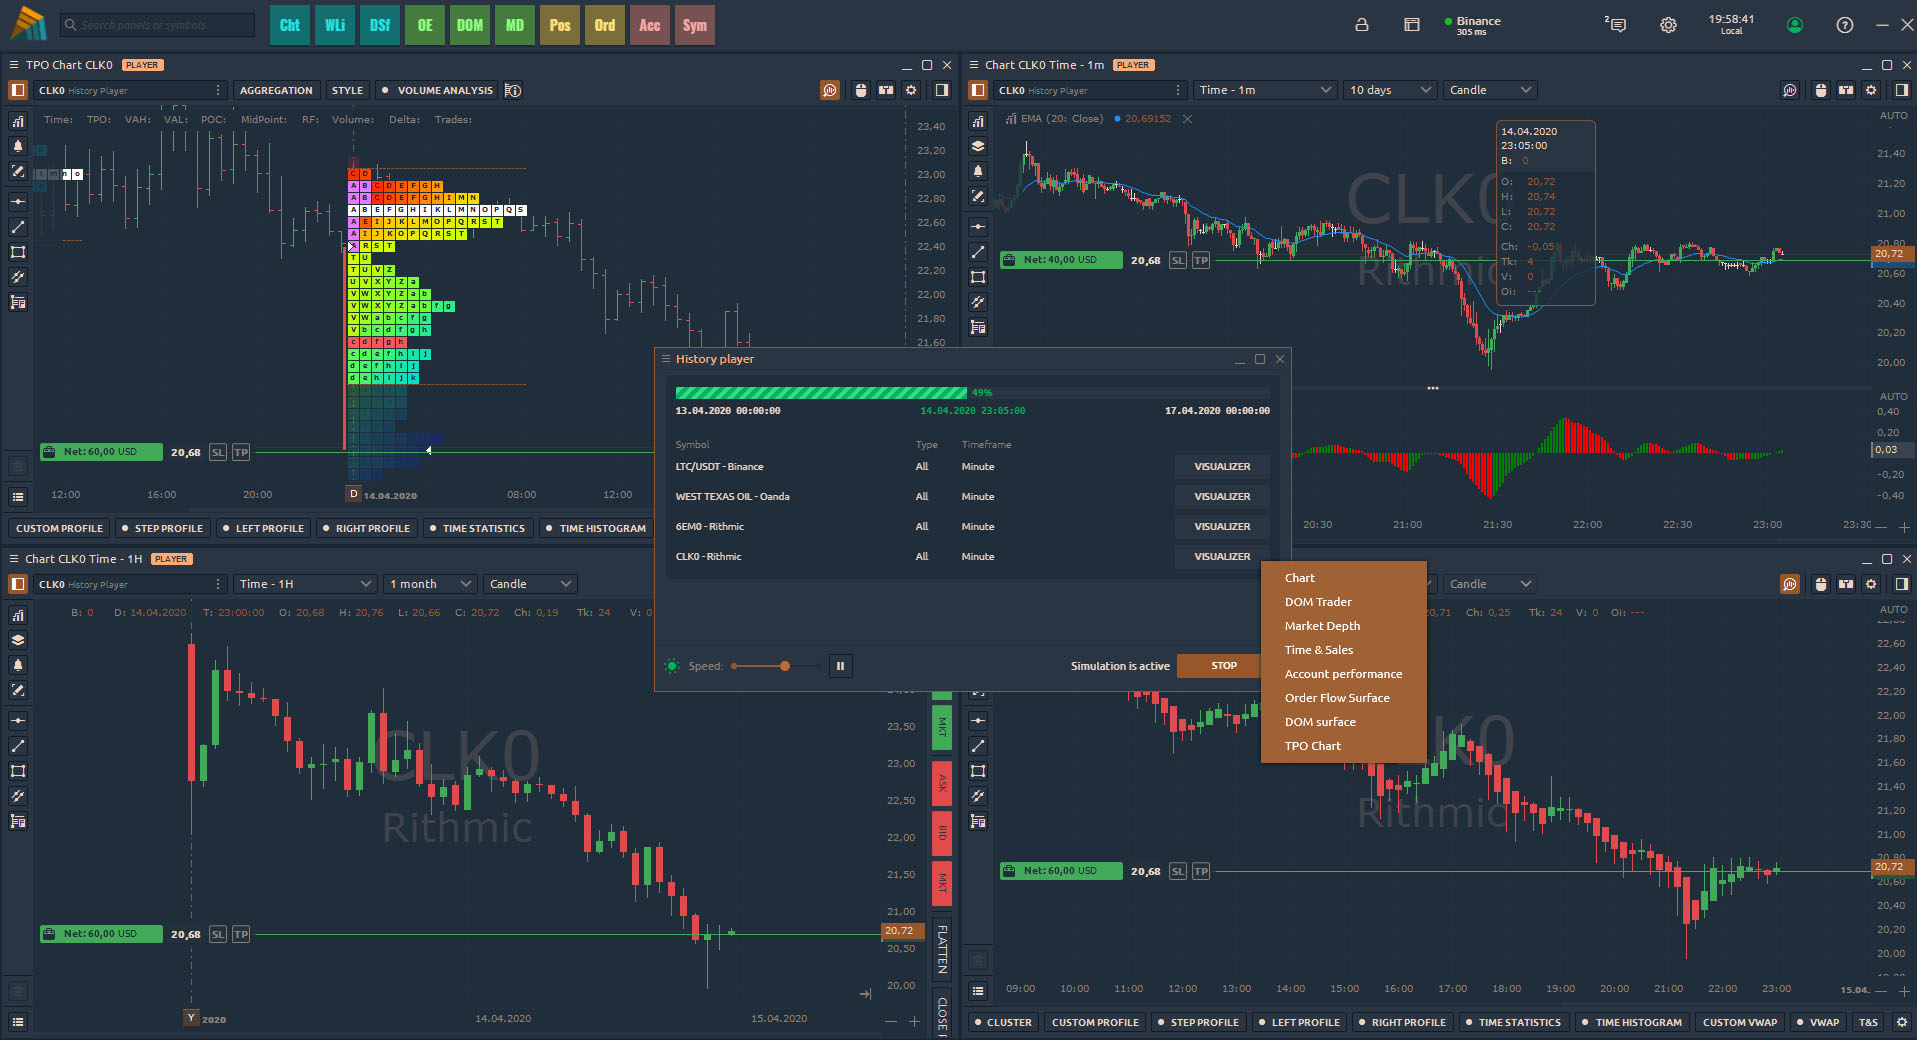
# Welcome to 3rd Dimension Help

Here you’ll find all the detailed documentation for 3rd Dimension features, learn how to create and customize your Workspace, understand all settings, get to know advanced features, and more.

![](https://content.gitbook.com/content/urdqk4sHwHHpr4J3s5P6/blobs/AOpsqyZmv57LgR3fmNj9/image.png)

For ease of navigation, the Help system is divided into several categories that will allow you to quickly find the information you need:


# Getting started

Here are the articles in this section:

<table data-card-size="large" data-view="cards"><thead><tr><th data-card-target data-type="content-ref"></th></tr></thead><tbody><tr><td><a href="/getting-started/whats-new">What's new</a></td></tr><tr><td><a href="/getting-started/installation">Installation</a></td></tr><tr><td><a href="/getting-started/first-start">First start</a></td></tr><tr><td><a href="/getting-started/platform-update">Platform update</a></td></tr><tr><td><a href="/getting-started/3rd-dimension-beta">3rd Dimension Beta</a></td></tr><tr><td><a href="/getting-started/3rd-dimension-account">3rd Dimension Account</a></td></tr><tr><td><a href="/getting-started/3rd-dimension-licenses">3rd Dimension Licenses</a></td></tr><tr><td><a href="/getting-started/license-comparison">License Comparison</a></td></tr><tr><td><a href="/getting-started/backup-and-restore-manager">Backup &amp; restore manager</a></td></tr><tr><td><a href="/getting-started/reset-settings-to-default.">Reset settings to default.</a></td></tr><tr><td><a href="/getting-started/coinpayments-payment">“Coinpayments” payment</a></td></tr><tr><td><a href="/getting-started/referral-program">Referral Program</a></td></tr></tbody></table>


# What's new

History of 3rd Dimension updates shows the changes that were in each version.

Each update of 3rd Dimension includes the addition of new features, bug fixes and performance optimization. In case of critical issues or errors that occur due to our fault, we immediately fix them and release a new update.

For a detailed overview of what has changed in each update, please see the Release Notes on our website:

* [3rd Dimension release notes](https://thirddimension.exchange/release-notes/)
* [3rd Dimension blog<br>](https://thirddimension.exchange/blog/)


# Installation

System requirements and 3 simple steps to successfully install the platform

* [System Requirements](#pc-requirements)
* [Installation Steps](#installation-steps)
* [Uninstallation](#uninstall)

Once you downloaded 3rd Dimension application from 3rd Dimension official website — you are ready to start an installation process. From this point we must clarify the main differences between 3rd Dimension "installation process" and default Windows® install process, that most users are accustomed to.

{% embed url="<https://youtu.be/vb151xz7nVU>" %}

{% hint style="success" %}
3rd Dimension  does not copy it's files to the system folders (AppData or Program Files) of the OS, nor does write changes to the system registry
{% endhint %}

What does it mean? The program doesn't violate the integrity of the OS, and in case of removal, it will not leave any prints of its presence on your computer. 3rd Dimension's "installer" literally extracts files to the user-specified folder.

This approach allows you to store (and launch) the 3rd Dimension on removable drive for use on any other computer as the portable application. It can be convenient when you need to move 3rd Dimension with all of its settings to another PC; just copy 3rd Dimension folder and paste where you need.

### PC requirements

{% hint style="info" %}

* Windows 7, 8.1, 10
* .NET Framework v.4.7
* Available disk space — 1 GB (depends on the volume of loaded history)
  {% endhint %}

{% hint style="warning" %}
Microsoft has officially stopped supporting Windows 8. Therefore, when you purchase a license, you will not be able to log in to the application under your account. In the free version, all available functionality of the platform will work properly. \
We recommend updating Windows to version 10.
{% endhint %}

### Installation steps <a href="#installation-steps" id="installation-steps"></a>

![](https://2549702640-files.gitbook.io/~/files/v0/b/gitbook-legacy-files/o/assets%2F-LermsgEXLRaKzd0flYx%2F-LeruZV8__TH-fFOK8lJ%2F-Leruz8enQ7BtI_J9wSu%2F2.PNG?alt=media\&token=dc1f40cb-884d-4e6c-9e47-5c86d6983dbb)

3rd Dimension installer screen

1. [**Download the app installer**](https://updates.thirddimension.exchange/3rd-Dimension/x64/3rd_Dimension.exe) and launch the ***3rd\_Dimension.exe*** file
2. Select the folder to extract application files
3. Once an extraction process being finished the platform will start automatically with **Emulator connection** enabled and the default workspace

{% hint style="warning" %}
Please note, that you may need to allow an in-going and outgoing connection for ***Starter.exe*** file (the main executable of 3rd Dimension terminal) in your Firewall settings
{% endhint %}

From this moment you can start trading and analysis as well as workspace customization

![The fist launch of 3rd Dimension platform](https://2549702640-files.gitbook.io/~/files/v0/b/gitbook-legacy-files/o/assets%2F-LermsgEXLRaKzd0flYx%2F-LervLBIOqyrZlV1c8L1%2F-LerxCpHaIjZpOVfMuEf%2F3.png?alt=media\&token=1960fcf8-d664-44dc-899d-1cf5e5e1509f)

### Uninstall

If you need to uninstall the application, just ***delete the folder with all application files***. You may also keep your personal settings (connection information & workspaces) by copying the Settings folder (can be found right in 3rd Dimension folder) before application delete. These Settings folder can be pasted to any other 3rd Dimension folder later.

You may also refer to [**Backup & Restore manager**](/getting-started/backup-and-restore-manager) to backup your settings in one file and restore them later.


# First start

After installation, the platform will start automatically with default workspace and Emulator connection to test the functionality.

{% embed url="<https://youtu.be/vb151xz7nVU>" %}

The first start of 3rd Dimension terminal brings you the testing environment with the key trading features allowed. This state can be called DEMO-mode, but in spite of other platforms, 3rd Dimension doesn't require you to register in order to try. Once the platform was launched, you will get several elements of the platform, automatically created for testing purposes:

*
* **"Bind"** with several most popular trading panels
* An active **connection to Emulator**
* An opened positions (can be seen in positions panel)

![](https://2549702640-files.gitbook.io/~/files/v0/b/gitbook-legacy-files/o/assets%2F-LermsgEXLRaKzd0flYx%2F-LervLBIOqyrZlV1c8L1%2F-LerxCpHaIjZpOVfMuEf%2F3.png?alt=media\&token=1960fcf8-d664-44dc-899d-1cf5e5e1509f)

Default Workspace with merged panels in Bind

From this point, you can start using 3rd Dimension. Try to customize the workspace, open new panels or create your first orders.

### &#x20;<a href="#emulator-connection" id="emulator-connection"></a>

An emulator is a DEMO connection, available in 3rd Dimension connections screen. Technically, it is a special module of 3rd Dimension’s core, that provides generated quotes and emulates a trading process. This means that once you've connected to Emulator, it will start to produce the fake quotes for a limited list of symbols. ***Just for testing purposes!***

Please note! Emulator consumes a certain amount of resources of your PC, so it can influence its performance. We recommend you to disconnect in case you don’t use it.

### &#x20;<a href="#id-3rd-dimension-free-version" id="id-3rd-dimension-free-version"></a>

By default, you will be using 3rd Dimension platform in free version, where you have a limited functionality. The list of features, that available in FREE version you can find on a [Pricing page of 3rd Dimension website](http://thirddimension.exchange/pricing/).


# Platform update

3rd Dimension — is a constantly developing application that is why you can be sure to open more and more useful features each day.

Our team strives to release the new updates as soon as possible, usually at least a couple times per month.

3rd Dimension automatically checks for updates on start and re-checks them every 10 minutes in the background. It helps you to get known about the latest updates just after we release them .

![](https://content.gitbook.com/content/urdqk4sHwHHpr4J3s5P6/blobs/n5PzFvCn14ZgyiWWtINH/The%20green%20arrow%20on%20the%20logo%20indicates%20that%20a%20new%20update%20is%20available..png)

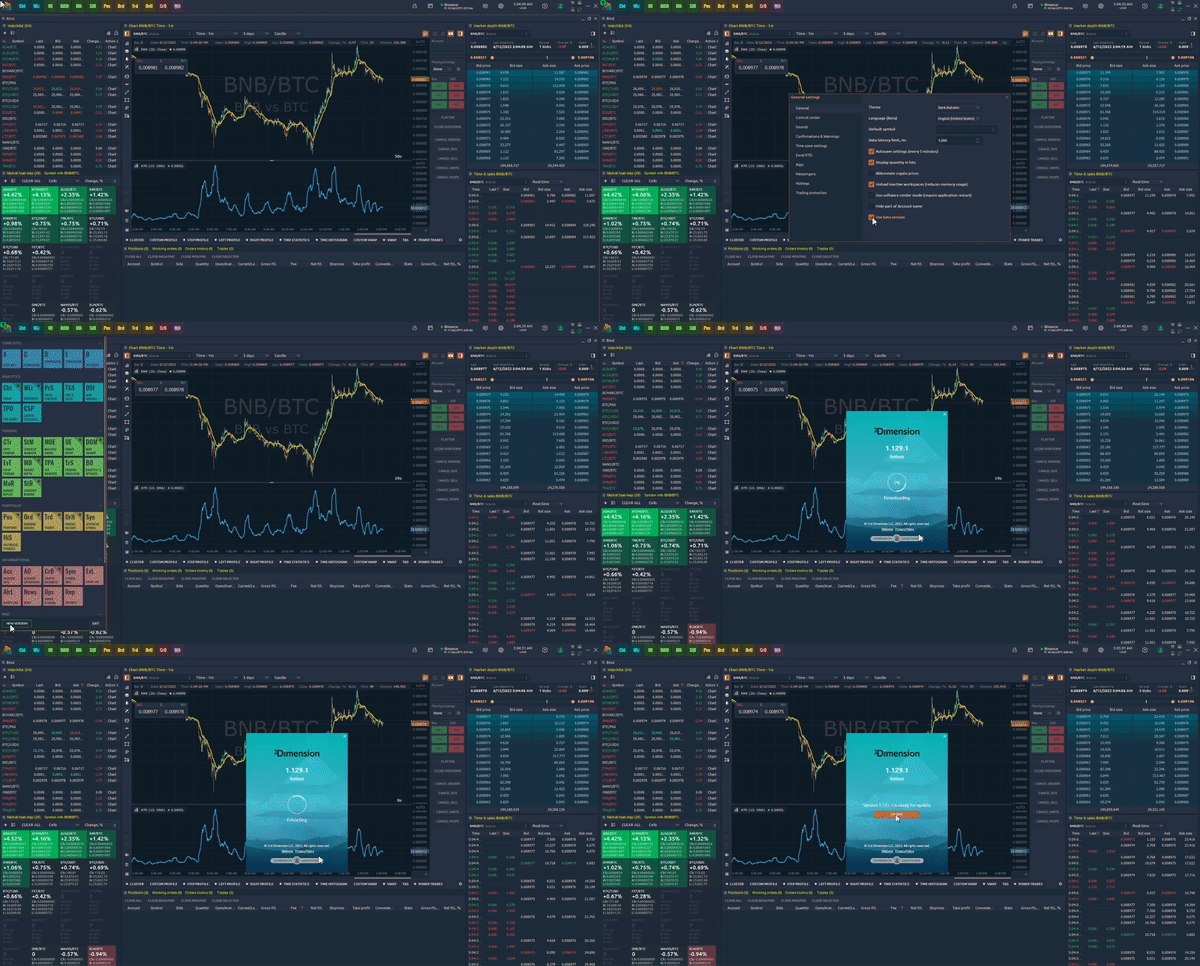
A green arrow will appear near the logo when a new version is available. Сlick on the "***Logo***" icon and open the sidebar, then press the “***NEW VERSION***” button at the bottom and get on About screen.

![](https://content.gitbook.com/content/urdqk4sHwHHpr4J3s5P6/blobs/9i39CMXYMa2QPVtzsriH/New%20version%20is%20available%20for%20download.png)

Press the "***DOWNLOAD***" button, and 3rd Dimension will download the latest version and prepare it for the update. When the download process is finished, 3rd Dimension will ask you about the restart. This action is required to apply the new version, but you can cancel the reboot and proceed using an application. In this case, updates will be applied on the next start of 3rd Dimension.Press the "***DOWNLOAD***" button, and 3rd Dimension will download the latest version and prepare it for the update. When the download process is finished, 3rd Dimension will ask you about the restart. This action is required to apply the new version, but you can cancel the reboot and proceed using an application. In this case, updates will be applied on the next start of 3rd Dimension.

{% hint style="danger" %}
If you accept an application restart for the update, it will close and reopen with the new version. This may take some time, and trading will be unavailable.
{% endhint %}

All of your local settings will be saved and applied for future updates because the update changes the Core files only.

### Rollback to previous version


# 3rd Dimension Beta

With Beta version you will receive updates to new functionality that is still in testing.

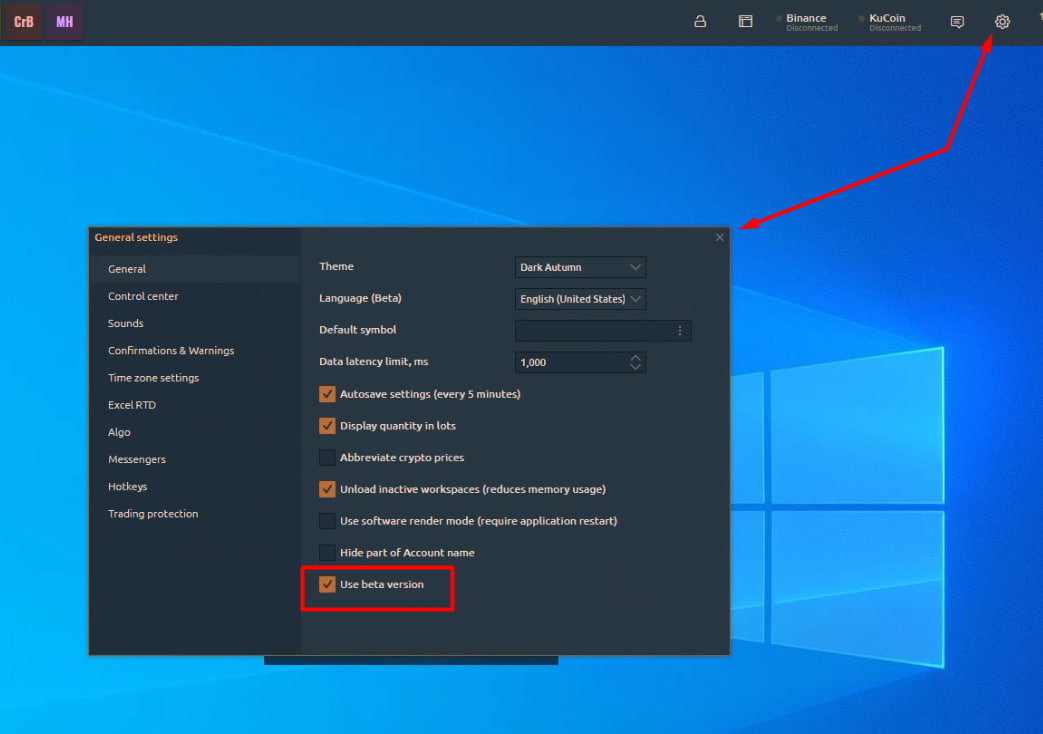
**Beta Version.** When this option is activated, you will receive updates to new functionality that is still in testing. We strive for our traders to use fully working functionality, but for this, we need the help of each user. Therefore, we ask as many people as possible to use the Beta version to inform us about possible bugs that eluded our testers.

<figure><img src="https://content.gitbook.com/content/urdqk4sHwHHpr4J3s5P6/blobs/GJ0OiTqDZyslFFVOLl5x/ezgif-4-a22db7cbca.gif" alt=""><figcaption><p>how to get beta updates</p></figcaption></figure>

Activate the **"Use Beta Version"** option and [**update the platform**](/getting-started/platform-update) to the latest version.

<figure><img src="https://content.gitbook.com/content/urdqk4sHwHHpr4J3s5P6/blobs/XdpYw5ZbxuwefwT8VCkc/use%20beta%20options.jpg" alt=""><figcaption></figcaption></figure>


# 3rd Dimension Account

3rd Dimension account (Account) is a part of Licensing functionality. It is required to bind a paid licenses for 3rd Dimension software and its add-ons per account holder.

{% hint style="info" %}
Actually, you don’t require to have an Account while using a **Free version** of 3rd Dimension.
{% endhint %}

Once you start using some paid feature, you will be asked to Login to your Account, so 3rd Dimension could verify whether you have the permission to use it. From this moment you can cancel the authorization process or proceed to log in. Once canceled you just won’t be able to use that paid feature. If you decide to log in, you need to have an Account and one of the paid licenses bound with it.

## Account creation

There are two ways to get yourself an Account:&#x20;

* proceed to Log in when you have been asked for in 3rd Dimension application;&#x20;
* go to  [accounts.3rddimension.qtower.app](http://accounts.3rddimension.qtower.app/) via your favorite browser.

![3rd Dimension Account Log in form](https://content.gitbook.com/content/urdqk4sHwHHpr4J3s5P6/blobs/ntScrBJlLYAuQh1GpLP8/Quantower%20Account%20Log%20in%20form.PNG)

In both ways you will get to Account log in form.&#x20;

| If you don’t have an account                  | Already have an Account                         |
| --------------------------------------------- | ----------------------------------------------- |
| Press the **GET STARTED** link in the footer. | Enter your credentials and press **SIGN ME IN** |

{% hint style="warning" %}
After you submit the Registration form, you will get a verification email on the address, you have specified. You should follow the link from that email to complete the Registration process.
{% endhint %}

## Account management

You can manage your account after registration in your personal cabinet [accounts.3rddimension.qtower.app](http://accounts.3rddimension.qtower.app/) Here you can:&#x20;

* see you currently active licenses.
* buy or prolong licenses.
* change your Account password.

## Account removal

You can apply for removing your account by contacting 3rd Dimension Support via any applicable way: [http://thirddimension.exchange/contact-us/](http://thirddimension.exchange/contact-us).


# 3rd Dimension Licenses

{% hint style="info" %}
In case of any problems with your 3rd Dimension Account or License purchase — please [contact our Support team](http://thirddimension.exchange/contact-us/)
{% endhint %}

We deliver the most popular trading and analytics functionality for free, but some valuable and market-specific features are available under the paid License.

To use any paid License, the trader needs to have an active [3rd Dimension Account](/getting-started/3rd-dimension-account). If you don’t have one, you can create it during your License purchase process.

## License types

We offer a user with a Free license and two paid Licenses — Basic & Premium.&#x20;

**Free license** is granted by default once you have created a 3rd Dimension Account. Also, it will be available all the time when you don’t have any active paid License. Using Free license, you can freely connect to and trade with any available vendor as well as use the most panels and functions of the platform.

**Basic license** includes some additional functionalities for working with symbol’s history, unlimited chart overlays, and trading simulation.

**Premium license** gives access to the maximum set of 3rd Dimension features including professional and niche-specific trading functionality. Third-party plug-ins are charged separately.

{% hint style="info" %}
Check the [Licenses comparison table](http://thirddimension.exchange/pricing/) on the 3rd Dimension website.
{% endhint %}

## License purchase

If you would like to upgrade your Free license, go to our [Pricing page](http://thirddimension.exchange/pricing/) and click on the **BUY BASIC** or **BUY PREMIUM** button.

The purchase process starts with the authorization in the 3rd Dimension service. Use your email and password to Sign in to the account. If you don’t have one yet, follow the instructions on [3rd Dimension Account manual](/getting-started/3rd-dimension-account). Just after you successfully Log in, you will be redirected to the purchase Cart.

Purchase cart contains the previously selected License type, term of validity and final Price. You can modify the term of validity to any desired option.

The next step is to select a payment provider and press the **Pay** button.

{% hint style="success" %}
Also, you can make payments in cryptocurrencies or use direct bank transfers. To do it contact our support team.
{% endhint %}

![Order payment for 3rd dimension license](https://content.gitbook.com/content/urdqk4sHwHHpr4J3s5P6/blobs/GBbSEbwJdZO5Wi3C1nhh/pay1.png)

After that, you will be redirected to the provider’s payment page. Once you complete all the payment steps, you will be redirected back to the confirmation page of 3rd Dimension Accounts. Follow the **GO TO DASHBOARD** link to get to your 3rd Dimension Account dashboard, where you should see you current Core License information and Payment transactions history.

## License terms

Currently, all licenses can be purchased for a 1-month term minimum. You can also get any 3rd Dimension paid License for the LIFETIME period — [contact our support](http://thirddimension.exchange/contact-us/) for this.

![Status of your licenses in Account dashboard](https://content.gitbook.com/content/urdqk4sHwHHpr4J3s5P6/blobs/KegH6XbwpFqJXVSkA44u/pay2.png)

## Quick tips on License purchase

* A free License is valid ALL THE TIME while your 3rd Dimension Account is active.
* Any paid License is active from the purchase date till the end date (“Available till”).
* Once your paid License is expired, the Account will be automatically downgraded to the Free License.
* Every new purchase for the similar license type extends the “Available till” date on the purchasing term.
* Subscription and automatic payments are currently unavailable.


# License Comparison

We provide the most popular trading & analytics features for free, but some valuable and market-specific features are available under the paid License.

Below you will find the detailed comparison table of licenses and platform features. [Prices are available on our official website](https://thirddimension.exchange/pricing)​

Licenses that are marked with the symbol **(\*)** can be purchased separately.

<table><thead><tr><th width="206">Features</th><th>Free </th><th>Premium</th><th>All in one</th><th data-hidden>Basic</th></tr></thead><tbody><tr><td><strong>Strategies &#x26;</strong><br> <strong>Special Indicat</strong></td><td></td><td></td><td></td><td></td></tr><tr><td><a href="/analytics-panels/chart/technical-indicators/diversified-divergence-divdiv">DivDiv</a>/<a href="/strategies-and-bots/divscanner">DivScanner</a>*</td><td>✖</td><td>RSI</td><td>✔</td><td>✖</td></tr><tr><td>Pump Catcher*</td><td>Nemo<br>Pump Catcher</td><td>Pirana<br>Pump Catcher</td><td>Dolphin<br>Pump Catcher</td><td>Nemo<br>Pump Catcher</td></tr><tr><td>SBS Scanner*</td><td>✖</td><td>✔</td><td>✔</td><td>✖</td></tr><tr><td><a href="/strategies-and-bots/tpa">Trade Personal Assistant (TPA)*</a></td><td><p>Free</p><p>TPA</p></td><td>TPA<br>Novice</td><td>TPA<br>Amateur</td><td><p>Free</p><p>TPA</p></td></tr><tr><td>TPO Chart*</td><td>✖</td><td>✖</td><td>✔</td><td>✖</td></tr><tr><td>​<a href="/analytics-panels/dom-surface">DOM Surface*</a></td><td>✖</td><td>✖</td><td>✔</td><td>✖</td></tr><tr><td><a href="/analytics-panels/chart/power-trades">Power Trades</a>*<a href="/analytics-panels/dom-surface">​</a></td><td>✖</td><td>✖</td><td>✔</td><td>✖</td></tr><tr><td><a href="/strategies-and-bots/spidergrid-2.0">SpiderGrid Bot 2.0</a></td><td>Nemo<br>SpiderGrid</td><td>Pirana<br>SpiderGrid</td><td>Dolphin<br>SpiderGrid</td><td>Nemo<br>SpiderGrid</td></tr><tr><td>Retracment Catcher</td><td>✖</td><td>✖</td><td>Retracment Catcher (Gazelle)</td><td>✖</td></tr><tr><td>Breakout Catcher</td><td>✖</td><td>✖</td><td>Breakout Catcher (Gazelle)</td><td>✖</td></tr><tr><td>3rd Market Cap</td><td>✖</td><td>✖</td><td>✔</td><td>✖</td></tr><tr><td>Whale Splash</td><td>✖</td><td>Whale Splash (Nemo)</td><td>Whale Splash (Beluga)</td><td>✖</td></tr><tr><td><strong>Essential Features</strong><br></td><td></td><td></td><td></td><td></td></tr><tr><td><p>Connection to Broker,​</p><p>​Data feed, Exchange​</p></td><td>One Only</td><td>All</td><td>All</td><td>All</td></tr><tr><td><p>Multiple workspaces,</p><p>​templates, binds,</p><p>​groups of panels</p></td><td>✔</td><td>✔</td><td>✔</td><td>✔</td></tr><tr><td>Chart Trading</td><td>✔</td><td>✔</td><td>✔</td><td>✔</td></tr><tr><td>Tick charts</td><td>✔</td><td>✔</td><td>✔</td><td>✔</td></tr><tr><td>Time-based charts</td><td>✔</td><td>✔</td><td>✔</td><td>✔</td></tr><tr><td><p>Standard and custom</p><p>timeframes</p></td><td>✔</td><td>✔</td><td>✔</td><td>✔</td></tr><tr><td><p>Drawing tools and</p><p>technical indicators (50+)</p></td><td>✔</td><td>✔</td><td>✔</td><td>✔</td></tr><tr><td>Chart alerts</td><td>✔</td><td>✔</td><td>✔</td><td>✔</td></tr><tr><td>​DOM Trader panel​</td><td>✔</td><td>✔</td><td>✔</td><td>✔</td></tr><tr><td>​Time &#x26; sales panel​</td><td>✔</td><td>✔</td><td>✔</td><td>✔</td></tr><tr><td>Stat matrix panel</td><td>✔</td><td>✔</td><td>✔</td><td>✔</td></tr><tr><td>Market Heatmap panel</td><td>✔</td><td>✔</td><td>✔</td><td>✔</td></tr><tr><td>Exchange times</td><td>✔</td><td>✔</td><td>✔</td><td>✔</td></tr><tr><td>Backup manager</td><td>✔</td><td>✔</td><td>✔</td><td>✔</td></tr><tr><td>History Exporter</td><td>✔</td><td>✔</td><td>✔</td><td>✔</td></tr><tr><td>Export chart data</td><td>✔</td><td>✔</td><td>✔</td><td>✔</td></tr><tr><td>Strategy Runner panel</td><td>✔</td><td>✔</td><td>✔</td><td>✔</td></tr><tr><td>Alerts Log panel</td><td>✔</td><td>✔</td><td>✔</td><td>✔</td></tr><tr><td><p>Access to free API for developing</p><p>custom indicators, strategies</p></td><td>✔</td><td>✔</td><td>✔</td><td>✔</td></tr><tr><td>Algo extension for Visual Studio</td><td>✔</td><td>✔</td><td>✔</td><td>✔</td></tr><tr><td></td><td></td><td></td><td></td><td></td></tr><tr><td><strong>​ADVANCED FEATURES</strong><br></td><td></td><td></td><td></td><td></td></tr><tr><td>Simultaneous connections</td><td>✖</td><td>All</td><td>All</td><td>All</td></tr><tr><td>Indicators per 1 chart</td><td>2</td><td>∞</td><td>∞</td><td>∞</td></tr><tr><td>​Chart Overlays​</td><td>1</td><td>∞</td><td>∞</td><td>∞</td></tr><tr><td>​Renko chart​</td><td>✖</td><td>✔</td><td>✔</td><td>✔</td></tr><tr><td>​Kagi chart​</td><td>✖</td><td>✔</td><td>✔</td><td>✔</td></tr><tr><td>​Point &#x26; Figure chart​</td><td>✖</td><td>✔</td><td>✔</td><td>✔</td></tr><tr><td>​Heiken Ashi​</td><td>✖</td><td>✔</td><td>✔</td><td>✔</td></tr><tr><td>​Range Bars​</td><td>✖</td><td>✔</td><td>✔</td><td>✔</td></tr><tr><td>​Volume Bars​</td><td>✖</td><td>✔</td><td>✔</td><td>✔</td></tr><tr><td>​Indicators in Watchlist​</td><td>✖</td><td>✔</td><td>✔</td><td>✔</td></tr><tr><td>Synthetic Symbols &#x26; Spreads</td><td>✖</td><td>✔</td><td>✔</td><td>✔</td></tr><tr><td>​Trading Simulator​</td><td>✖</td><td>✔</td><td>✔</td><td>✔</td></tr><tr><td>​Market Replay​</td><td>✖</td><td>✔</td><td>✔</td><td>✔</td></tr><tr><td>​RTD Excel function​</td><td>✖</td><td>✔</td><td>✔</td><td>✔</td></tr><tr><td></td><td></td><td></td><td></td><td></td></tr><tr><td><strong>​VOLUME ANALYSIS TOOLS</strong><br></td><td></td><td></td><td></td><td></td></tr><tr><td>​Cluster chart (Footprint)​</td><td>✖</td><td>✔</td><td>✔</td><td>✖</td></tr><tr><td>Footprint Imbalances</td><td>✖</td><td>✔</td><td>✔</td><td>✖</td></tr><tr><td><p>​All types of Volume Profiles ​</p><p>​(Right, Left, Custom, Step)​</p></td><td>✖</td><td>✔</td><td>✔</td><td>✖</td></tr><tr><td>​Time Statistics​</td><td>✖</td><td>✔</td><td>✔</td><td>✖</td></tr><tr><td>​Time Histogram​</td><td>✖</td><td>✔</td><td>✔</td><td>✖</td></tr><tr><td>​VWAP​</td><td>✖</td><td>✔</td><td>✔</td><td>✖</td></tr><tr><td>​Anchored VWAP (custom)​</td><td>✖</td><td>✔</td><td>✔</td><td>✖</td></tr><tr><td>​Dynamic VPOC indicator​</td><td>✖</td><td>✔</td><td>✔</td><td>✖</td></tr></tbody></table>


# Backup & restore manager

## General <a href="#general" id="general"></a>

Backup & restore manager plugin allows to keep your settings safe and restore them in case of troubles with the application. This smart tool can backup your global settings, connections credentials, workspaces and per panel layout settings in one local file, that can be used later to restore them in several clicks.

![Backup & restore master starting screen](https://content.gitbook.com/content/urdqk4sHwHHpr4J3s5P6/blobs/B7AsYXU7Lp4VOUMJNC6w/image.png)

## Backup settings <a href="#backup-settings" id="backup-settings"></a>

The backup process is easy and doesn’t require many explanations. Just select the path where your backup file will be stored (3rd Dimension backups folder by default; recommended) and press the **\[ CREATE BACKUP ]** button.

Once the process is started, you will see the progress screen, showing the backup process flow. When the backup will be finished you can press the **\[ FINISH ]** button to get to the starting screen. Each backup is created with the automatic name by the template: “Date Time.zip”.

You may find some backup files in 3rd Dimension Backup folder, containing the “**A**” letter at the end — these are the Automatic backups, periodically made by 3rd Dimension (daily, overridden each 5 min).

## Restore settings <a href="#restore-settings" id="restore-settings"></a>

In case you want to restore some previous settings or wish to apply some custom settings (got from another 3rd Dimension user, that backed up its settings previously), follow the **\[ RECOVER SETTINGS ]** button.

![](https://content.gitbook.com/content/urdqk4sHwHHpr4J3s5P6/blobs/yy8zLVUUKguzl5lJ1Dtt/RestoreSettings.png)

Recover your settings in several clicks

Here you can find two ways of Backup file selection:

* From backups folder
* From custom file

The “***Backups folder***” is the default 3rd Dimension folder where it saves all automatically created backup files and proposes it to store yours, manually created. The Backup & restore manager checks this folder and displays you all the found files to import settings. You may also select some different location of your backup file, using the “***From custom file***” option.

Please make sure, that you are specifying the correct backup file (made by B\&R manager earlier) to avoid the problems with settings import and restore.

Once you select the required backup file and press the **\[ START RECOVERY ]** button, you will see the recovery process flow. When finished, you will be asked about the application restart. This is the required action to apply your newly imported settings.

In case of any problems with the backup file, B\&R manager will keep your current 3rd Dimension settings and inform you about it.

​


# Reset settings to default.

Follow this step-by-step guide to reset platform's settings to default

Settings folder contains all the workspaces, saved templates, as well as all the visual changes that have been applied to panels, indicators, drawing tools. Below we will consider the basic operations that you can perform with the settings folder for comfortable work with the platform.

* [**How to Reset All Settings to default**](#how-to-reset-all-settings-to-default)
* [**How to provide Settings and Logs for developers (for checking an issue)**](#how-to-provide-settings-for-developers-for-checking-an-issue)
* [**How to share your Templates with other traders**](#how-to-share-your-templates-with-other-traders)
* [**How to share your  Workspaces with other traders**](#how-to-share-your-workspaces-with-other-traders)
* [**How to copy all settings to other PC**](#how-to-copy-all-settings-to-another-pc)

### How to Reset All Settings to default.

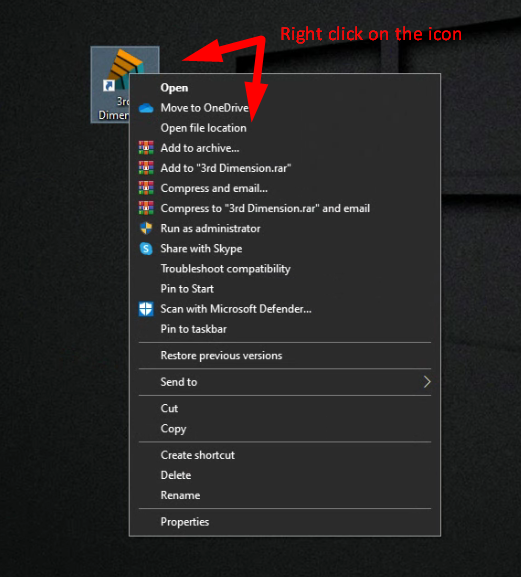
Sometimes all platform's settings need to be reset to default. To do this, close the platform, **Right-click** on 3rd Dimension icon and select **Open File Location** from the context menu.

{% hint style="success" %}
You can save the current settings if you want to return to them later. Just rename your **Settings** folder to something else, like ***Settings\_My*** etc.
{% endhint %}

<figure><img src="https://content.gitbook.com/content/urdqk4sHwHHpr4J3s5P6/blobs/QI76EAgUJHslRUOcElgD/Screenshot_4.png" alt=""><figcaption></figcaption></figure>

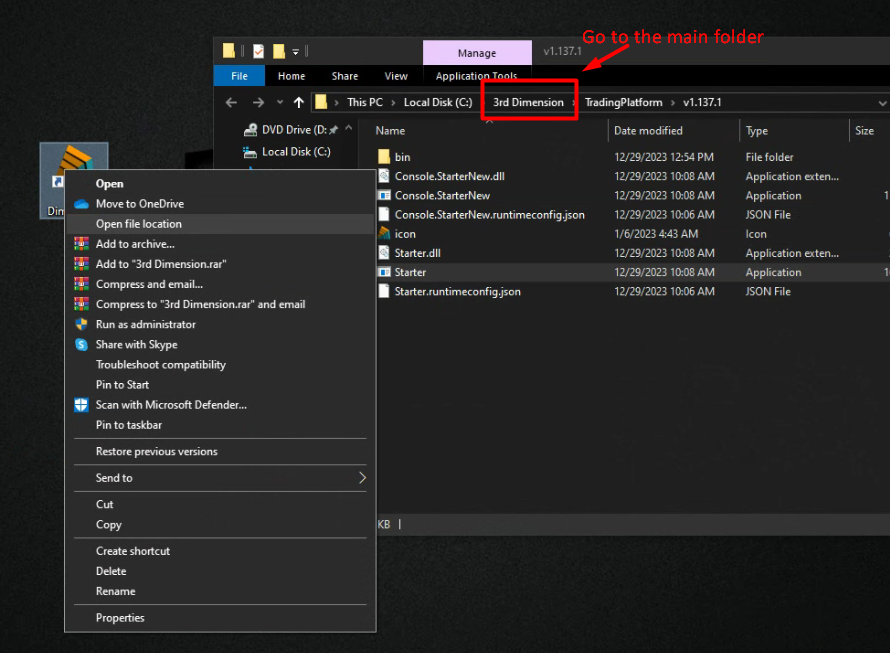
A folder with the main files of the latest (installed) version of the program will open. \
***Go to the main folder of the platform.***

<figure><img src="https://content.gitbook.com/content/urdqk4sHwHHpr4J3s5P6/blobs/YNUygVtvraqEyR1f0L7H/Screenshot_5.png" alt=""><figcaption></figcaption></figure>

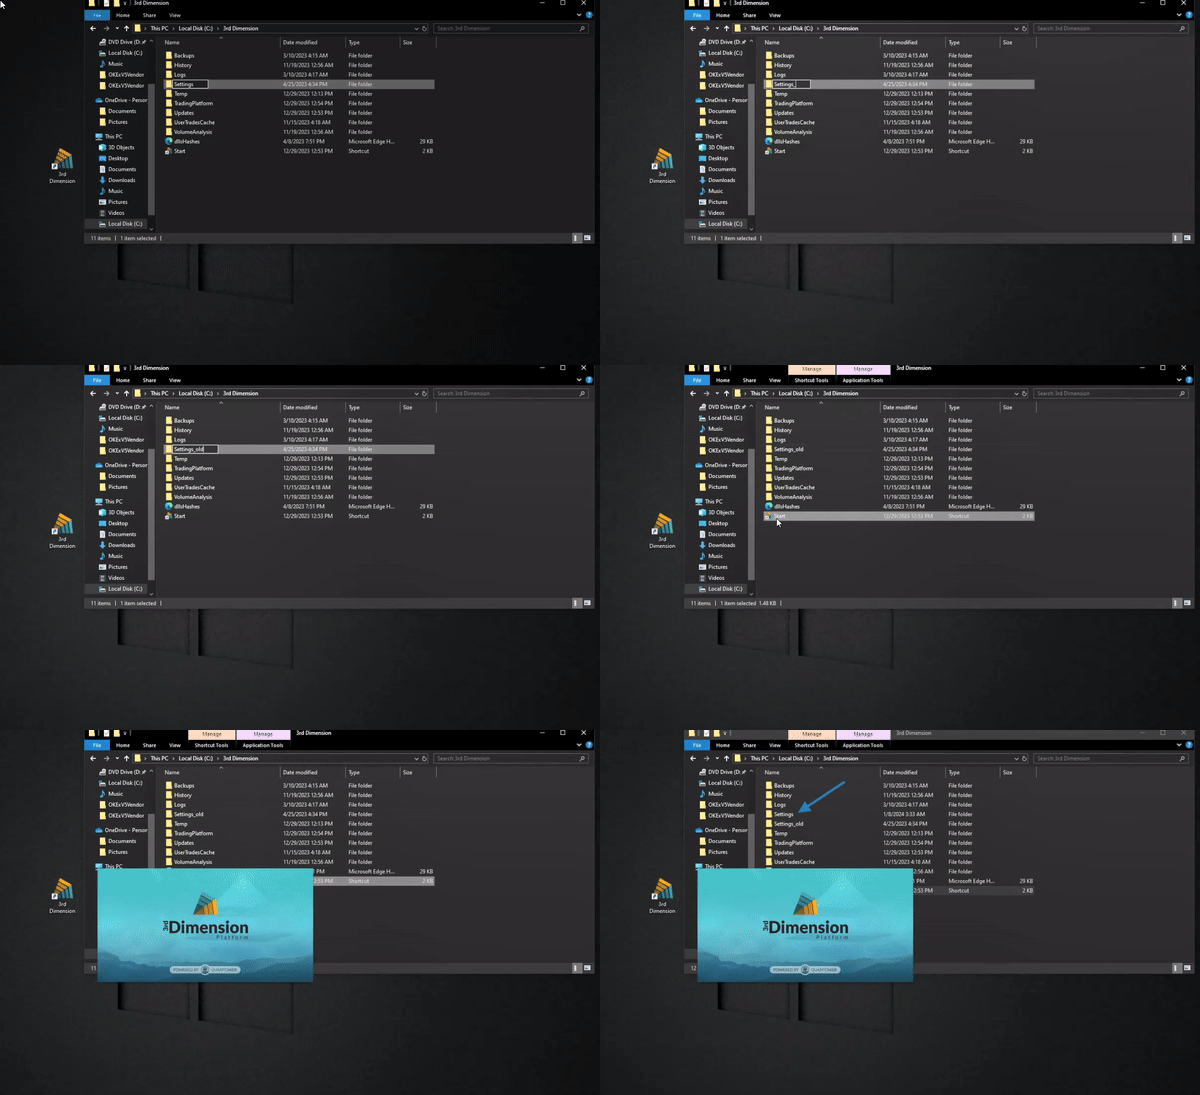
*Rename the **Settings** folder* (for example, Settings1 or Settings\_old). After you rename the folder, run the platform. The new Settings folder will automatically appear with default settings.

<figure><img src="https://content.gitbook.com/content/urdqk4sHwHHpr4J3s5P6/blobs/hQPNk5dL55NLGUyyxMDB/The%20new%20Settings%20folder%20will%20automatically%20appear%20with%20default%20settings.gif" alt=""><figcaption><p>The new Settings folder will automatically appear with default settings</p></figcaption></figure>

{% hint style="warning" %}
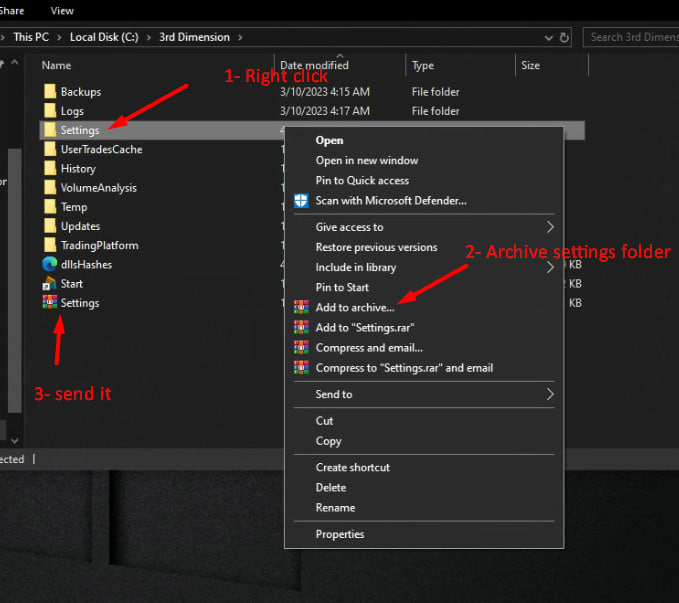
Before sending your Settings to developers for checking the problem, add the full settings folder to the ZIP or RAR archive and send it to **<support@thirddimension.exchange>** with a brief description of your problem.
{% endhint %}

### How to provide Settings for developers (for checking an issue)

Close the platform, **Right-click** on 3rd Dimension icon, and select **Open File Location** from the context menu.

<figure><img src="https://content.gitbook.com/content/urdqk4sHwHHpr4J3s5P6/blobs/QI76EAgUJHslRUOcElgD/Screenshot_4.png" alt=""><figcaption></figcaption></figure>

A folder with the main files of the latest (installed) version of the program will open.\
***Go to the main folder of the platform.***

<figure><img src="https://content.gitbook.com/content/urdqk4sHwHHpr4J3s5P6/blobs/YNUygVtvraqEyR1f0L7H/Screenshot_5.png" alt=""><figcaption></figcaption></figure>

Add the entire Settings folder to the archive and send this archive to us to check the problem.

<figure><img src="https://content.gitbook.com/content/urdqk4sHwHHpr4J3s5P6/blobs/9ZTVvWjkDK6TnJN5a4Im/photo_2024-01-08_15-02-23.jpg" alt=""><figcaption></figcaption></figure>

#### How to provide Log files?

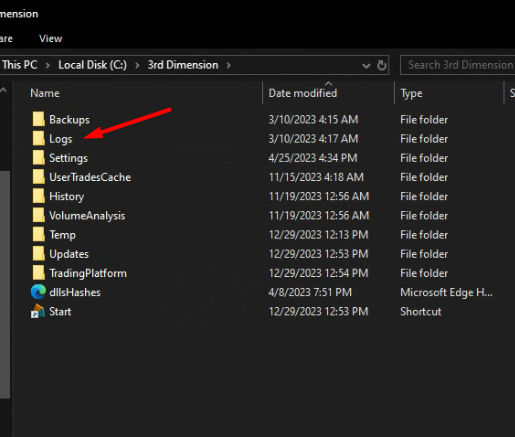
Moreover, for checking issues our developers can request Log Files. Please go to the **platform's main folder -> Logs -> Serilog -> send the latest file** or several latest files.&#x20;

<figure><img src="https://content.gitbook.com/content/urdqk4sHwHHpr4J3s5P6/blobs/gEvK8HLnej0FBWGfx7cr/3rd%20logs.png" alt=""><figcaption></figcaption></figure>

### How to share your Templates with other traders

{% hint style="success" %}
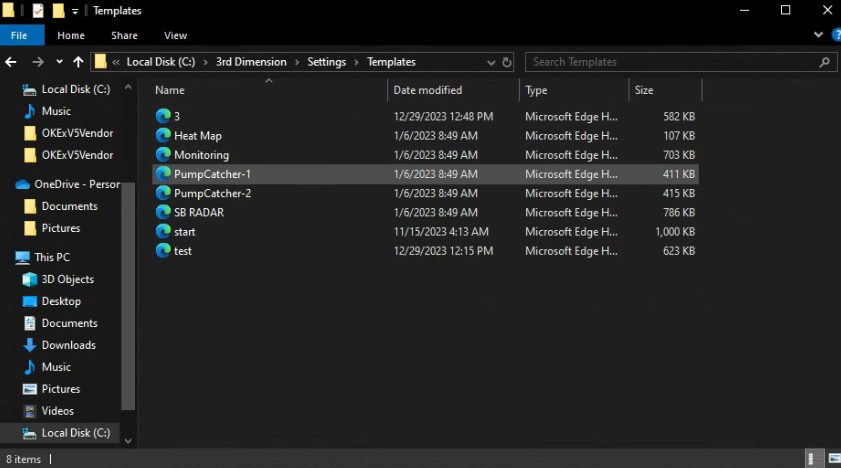
You can share your templates with other 3rd Dimension traders by sharing template files with them. Template files can be found in the folder **"3rd Dimension -> Settings -> Templates".**

The file to be transferred must be placed in a similar folder on another computer.
{% endhint %}

Recall that in the 3rd Dimension platform, all created templates are stored in the Control Center sidebar in the **"Templates"** group. Thus, you can launch any template from this location at any time with a single click. You can place your saved templates in the Favorites panel in the Control Center, just like any other default panel.

<figure><img src="https://content.gitbook.com/content/urdqk4sHwHHpr4J3s5P6/blobs/ZOPEMo9JWoRYUCauSCnX/templates.png" alt=""><figcaption></figcaption></figure>

### How to share your Workspaces with other traders

{% hint style="info" %}
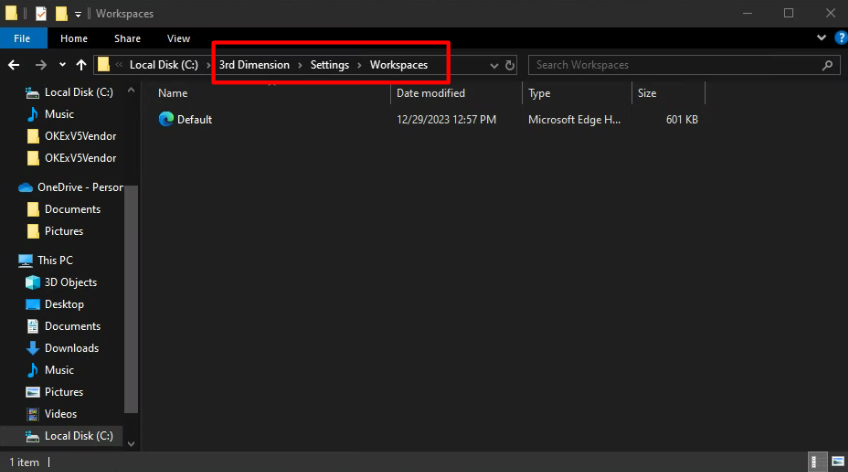
This is done in exactly the same way as described above, except that we transfer a different file **\3rd Dimension\Settings\Workspaces**

The file to be transferred must be placed in a similar folder on another PC.
{% endhint %}

<figure><img src="https://content.gitbook.com/content/urdqk4sHwHHpr4J3s5P6/blobs/rbEy9aEwsyMedH8D8voG/workspaces.png" alt=""><figcaption></figcaption></figure>

### How to copy all settings to another PC

{% hint style="info" %}
[Copy the settings folder to another PC](#how-to-provide-settings-for-developers-for-checking-an-issue) or COPY the entire 3rd Dimension folder to another PC. It is totally portable.
{% endhint %}


# “Coinpayments” payment

One of the most popular payment methods for 3rd Dimension licenses — is a Coinpayments service. It allows paying for advanced functionalities by various crypto assets (coins).

While the process of coins transfer between digital wallets is pretty usual and straightforward, we decided to mention some additional aspects of Quantower license purchase using crypto coins.

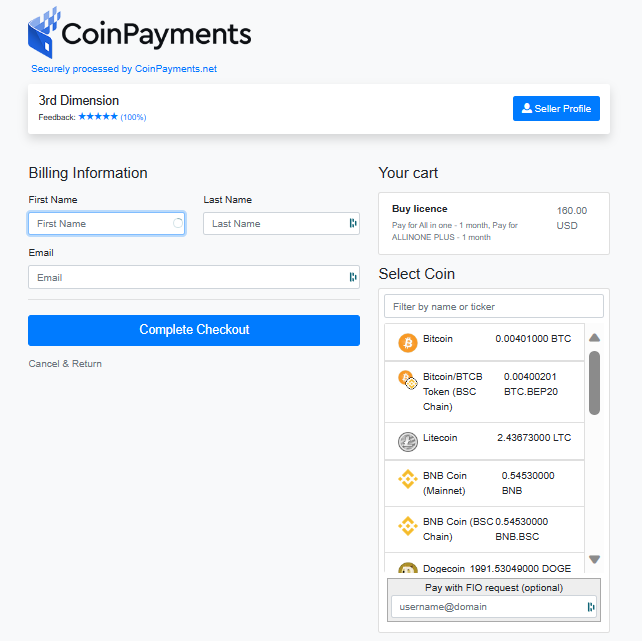
When you decide to pay for a license using your crypto-assets, you should press “Buy” for the required feature. Next, you should click “Pay with Coinpayments”. Now, you will be redirected to Coinpayments merchant where you should select a coin and then — “Complete Checkout”. You can register here, but it is not necessary.

<figure><img src="https://content.gitbook.com/content/urdqk4sHwHHpr4J3s5P6/blobs/eSOKvlfvCX4sjFjHAkbO/coinpayments.png" alt=""><figcaption><p>Coinpayments merchant page</p></figcaption></figure>

Here we would like to share some advice:

{% hint style="warning" %}
**There can be a commission for transfer**, depending on what coins you transfer and from what wallet. That’s why make sure you will transfer enough quantity of coins (including commission) to finish your payment. In case you send fewer coins than Coinpayments asked, you can fulfill the lack amount with an additional transfer.
{% endhint %}

{% hint style="info" %}
**Transfer time and a number of approvals differ from coin to coin**. Bitcoin requires many approvals and time to transfer, some less popular coins are transferred much faster. Sometimes it is worth it to buy some alt-coin and pay using it to speed up the purchase process.
{% endhint %}

## Purchase details page

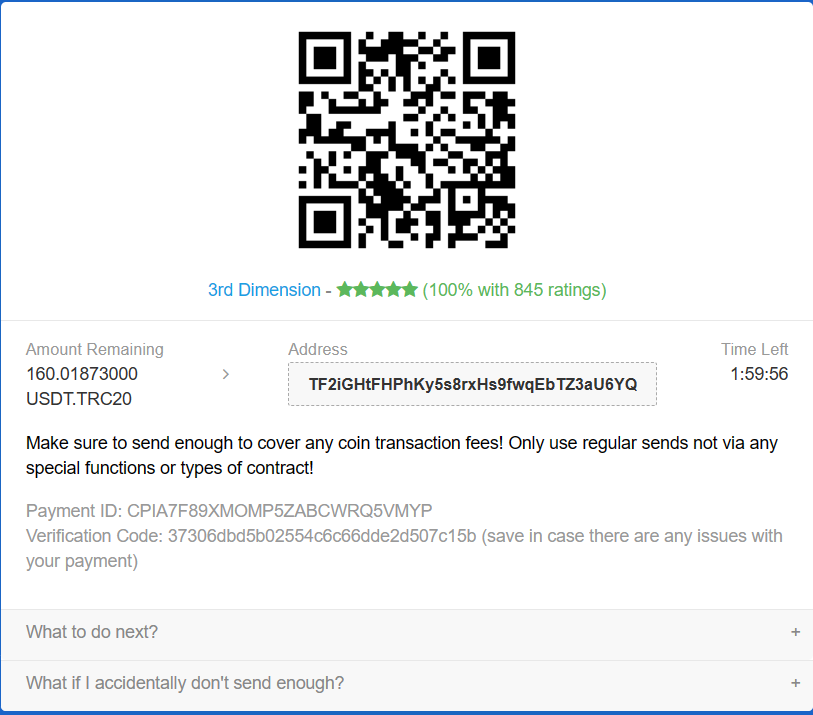
Next, you will be redirected to the temporary payment page that will be active for 2 hours. During this time you should transfer the selected coin to complete the purchase. We recommend you to stay on this page until you will see the successful purchase message.&#x20;

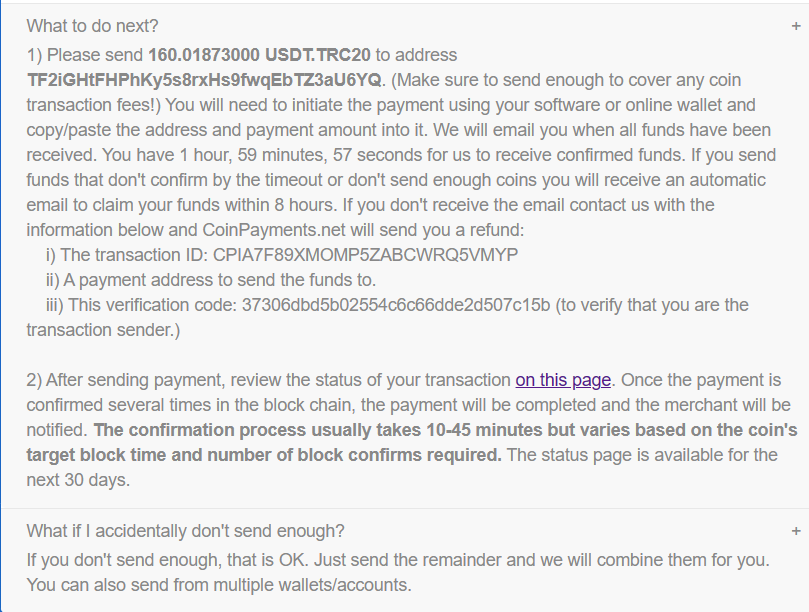
<div><figure><img src="https://content.gitbook.com/content/urdqk4sHwHHpr4J3s5P6/blobs/qtnAUl1kYQywrdmrUkjV/Screenshot_2.png" alt=""><figcaption><p>Payment details page</p></figcaption></figure> <figure><img src="https://content.gitbook.com/content/urdqk4sHwHHpr4J3s5P6/blobs/HJiNl0gaeXmxpoNektSl/Screenshot_3.png" alt=""><figcaption></figcaption></figure></div>

There are some important items on this page:

* **Payment ID**. Copy & save it somewhere, in case some technical fail (your PC turns off and you won’t reach this page). This ID is needed to contact Coinpayments for further transaction support.
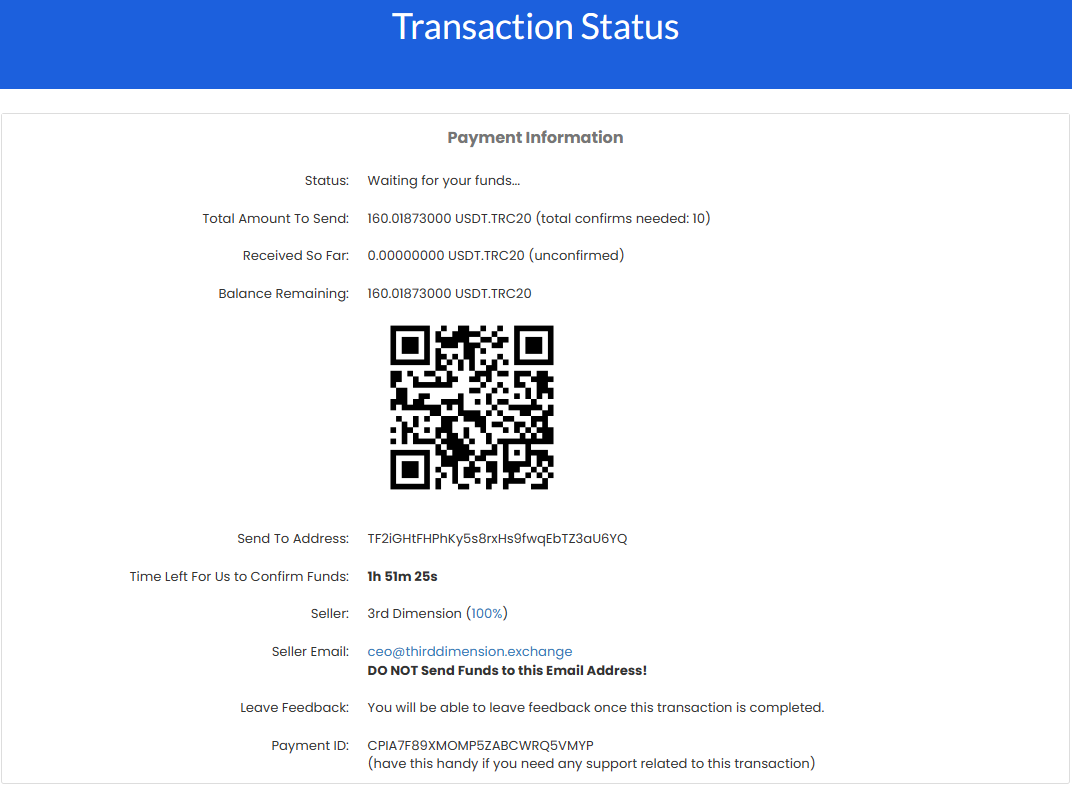
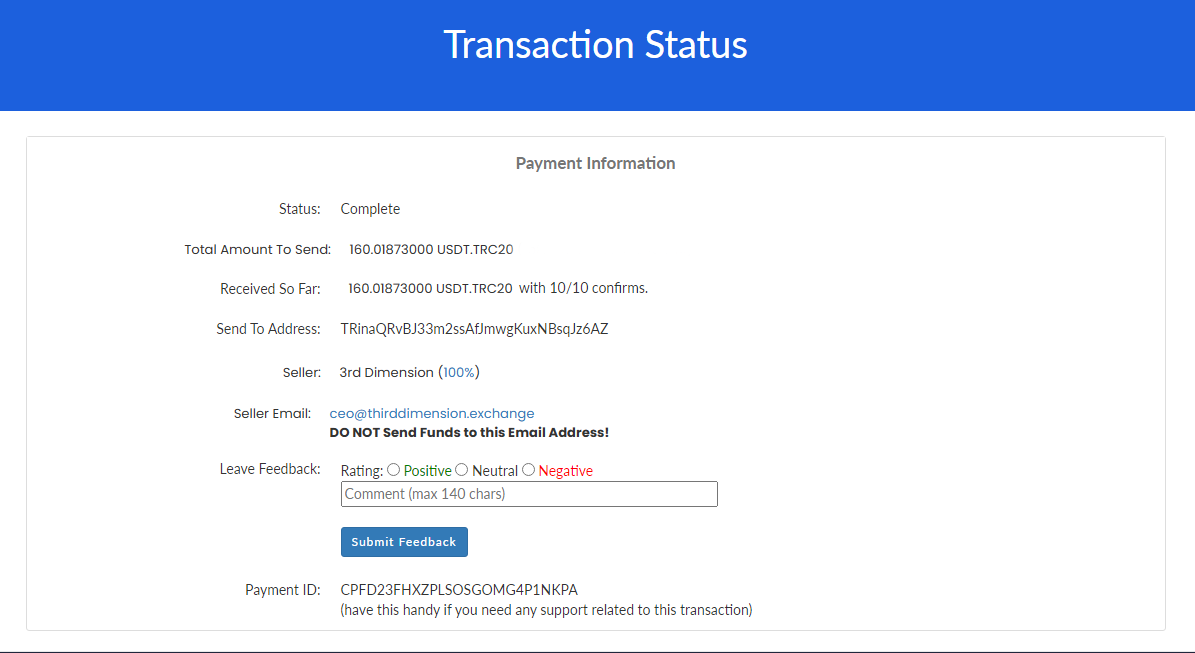
* **There is a transaction status page link**, where you can track the process of coin transfer (approves, amount, etc.). That page updates automatically.

<figure><img src="https://content.gitbook.com/content/urdqk4sHwHHpr4J3s5P6/blobs/8BpxYeoDvLSTzYCWTfbF/payment2.png" alt=""><figcaption><p>Transaction status page</p></figcaption></figure>

## Make a transfer

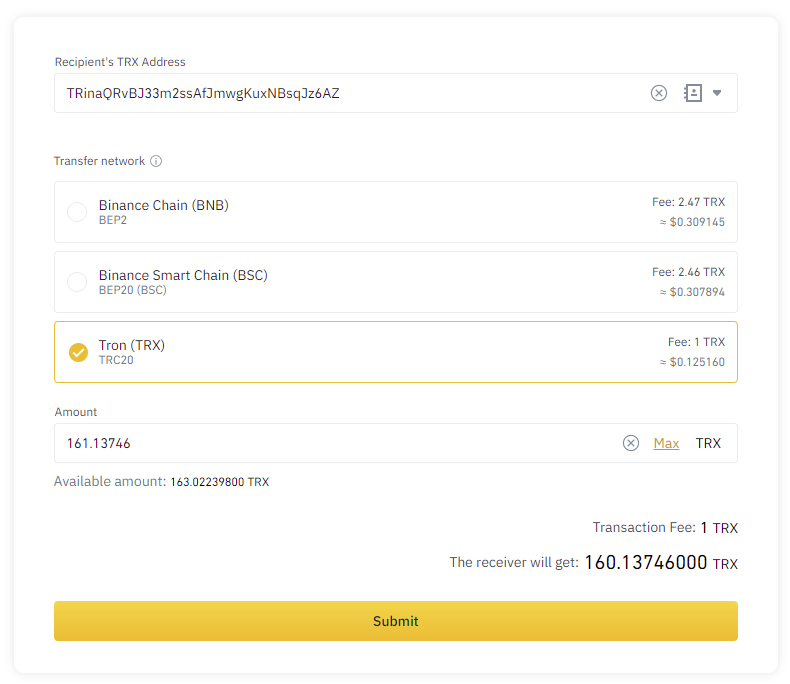
Now you need to make a transfer of the selected coins from your wallet. This process depends on where you are sending from. As an example, you can see how Binance informs about commissions and receiving amounts after transfer:

<figure><img src="https://content.gitbook.com/content/urdqk4sHwHHpr4J3s5P6/blobs/C52GkShuR1godmbttr1J/image.png" alt=""><figcaption><p>Binance wallet transfer page</p></figcaption></figure>

Let’s say that you’ve sent your coins and now waiting for the license assign. **The confirmation process usually takes 10-45 minutes** but varies based on the coin's target block time and the number of blocks confirms required. If you see that your coins were successfully sent from your wallet, it is not stated that Coinpayments already received them. If your payment lasts more than 30 minutes - please contact our support.

## License assignment check

There are some technical processes in the Coinpayments that should be accomplished before they inform us about the successful payment. These require time, so **your license can’t be assigned to your account until we get approval from Coinpayments**. Even if there is a Completed status.

<figure><img src="https://content.gitbook.com/content/urdqk4sHwHHpr4J3s5P6/blobs/jRi7saQNkunBLwXi9CmT/transaction%20%20status.webp" alt=""><figcaption><p>Completed transaction</p></figcaption></figure>

**To check whether your license was assigned to your account**, you should monitor the following sources:

* your account’s email address, where you should receive a notification about the successful payment;
* in your [3rd Dimension account panel](https://identity.accounts.3rddimension.qtower.app/Account/Login?ReturnUrl=%2Fconnect%2Fauthorize%2Fcallback%3Fclient_id%3DLicencesManager%26redirect_uri%3Dhttps%253A%252F%252Faccounts.3rddimension.qtower.app%252Fsignin-oidc%26response_type%3Dcode%2520id_token%26scope%3Dopenid%2520profile%2520email%2520offline_access%2520LicenceService%2520referral_code%26response_mode%3Dform_post%26nonce%3D638416872997342794.MTNmOWM2OTQtMGVlOS00N2ZmLWE3MTgtNTEzYTc0ZGFjZmQ2ZDliMTgzMjQtNTcxMC00NTY5LWFmYzYtYzlhODMxNjIwNTdj%26state%3DCfDJ8J4UTGvCkjhNvPNH7upxVd9Qp5pRM__snhiSdS0h6u1XU9djmR_tZq6ABLXJs6T74iqLOdDjTGmsatPOiAjzY8DyNgpb-LmubNrA4iPTgXDUJgZHlC-4BwMu7TqGCq-WU0CUhylBEUWscWFuoUM4YjQOfmTZ36_nf9n6ZJ-9UwjOxM8aFlr-lb6_zU7nuBnXbsuZdYKbwxhqjUbtfUjy2NP53wgOgT9v5cCwkCahzKKF40chLCFMay_DBps31w2unZnLjGphblFBnuCEYaHFF_K6Ys4cRjywYOIGXeWFGzGUlT_mpmUTerCrABlvxQGnMA%26x-client-SKU%3DID_NETSTANDARD2_0%26x-client-ver%3D5.5.0.0), in the Payments History section.

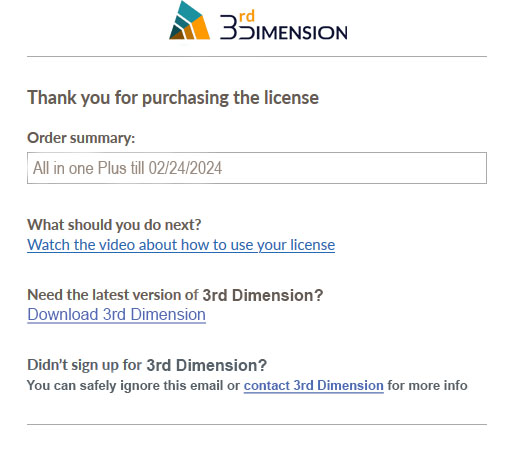
Once we receive approval from Coinpayments, we will immediately assign you a license and send you a confirmation email about the successful purchase. From this moment you can use your advanced feature.

<figure><img src="https://content.gitbook.com/content/urdqk4sHwHHpr4J3s5P6/blobs/ZZ7dhVxcIwOeSBGDmP2O/assets_.jpg" alt=""><figcaption><p>3rd Dimension  license payment is successfull</p></figcaption></figure>


# Referral Program

3rdDimension Referral Program — mutually-beneficial partnership, between us and our customers. Start earning real money right now.

Our Referral Program allows you to earn real money, that can be spent on buying the 3rdDimension licenses or even be withdrawn on demand. The earning process is simple: you receive **15% from each purchase** sum of your referral. We can increase % depending on our own view!

{% hint style="warning" %}

* Your referral (the person you invited) must **register an account** in our license system **Through Your Link!** Otherwise, he will not be counted as your referral.
* If your referral created a new account (**or changed email**) without your referral link, then his purchases will not be counted in your payments
  {% endhint %}

### **There are 4 simple steps to start earning by inviting your friends to 3rdDimension:**

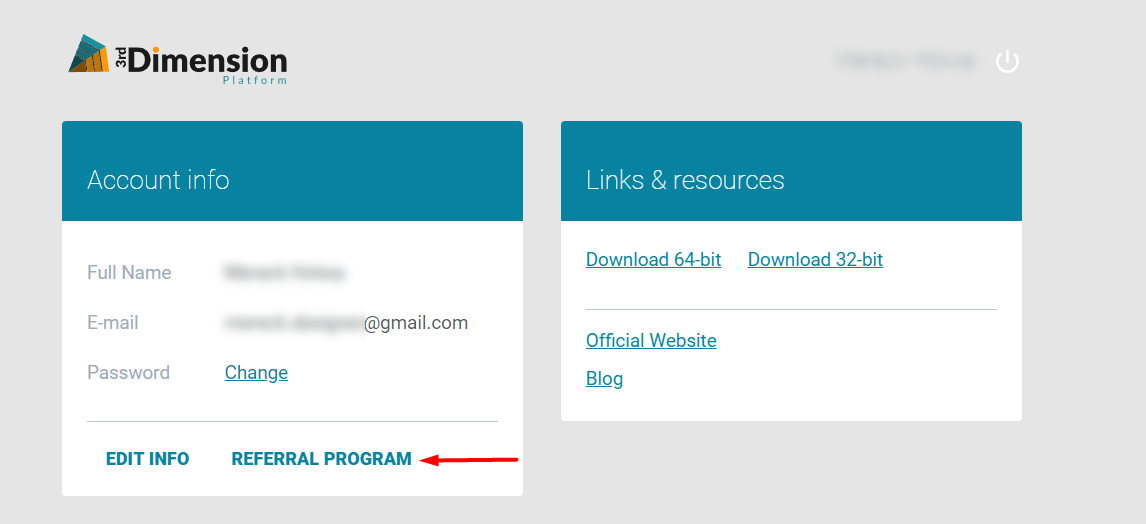
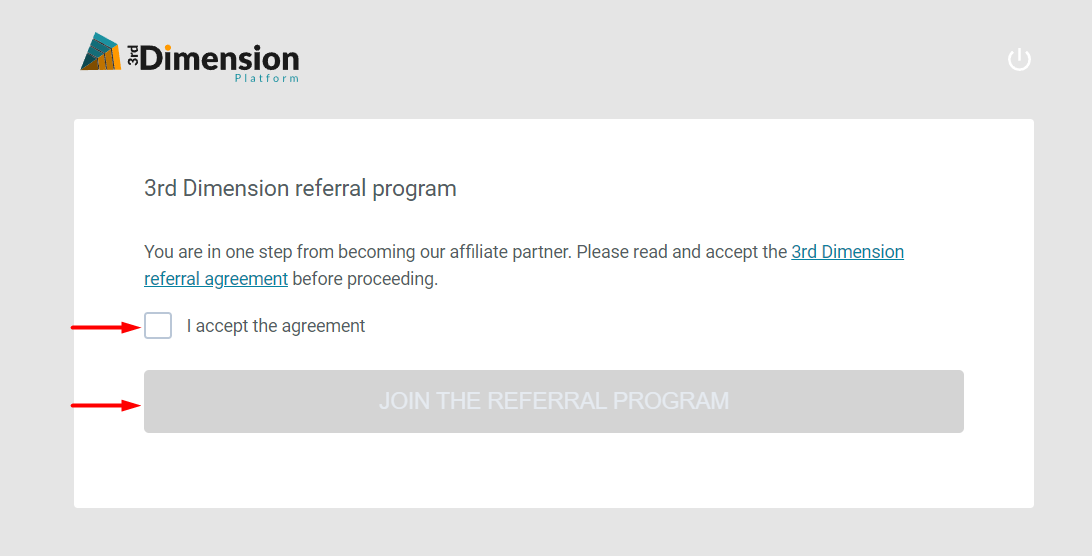
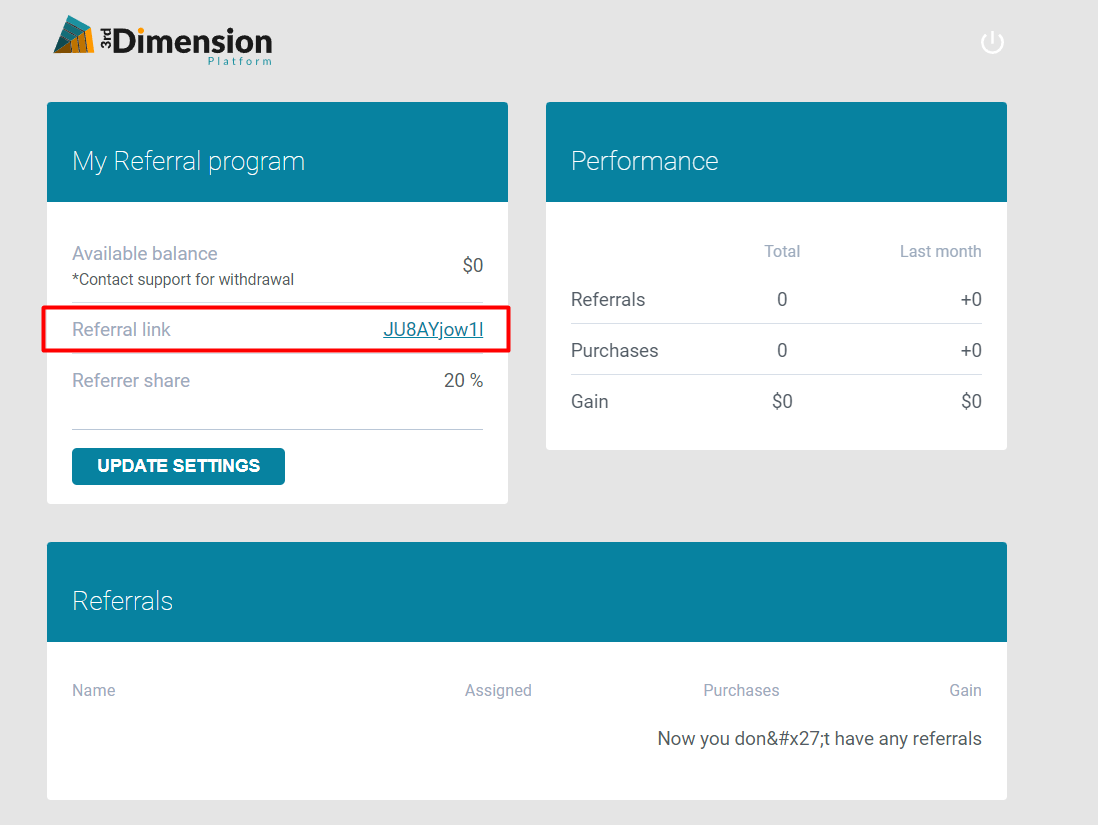
* **Get a link with your code.** Any registered customer of 3rdDimension can find its referral code from within the personal account page (<https://accounts.3rddimension.qtower.app>) \
  You will be able to **copy the full referral link to start sharing immediately**.

<figure><img src="https://content.gitbook.com/content/urdqk4sHwHHpr4J3s5P6/blobs/E4d0c16a4oeNumx22JDT/Screenshot_1.png" alt=""><figcaption></figcaption></figure>

<figure><img src="https://content.gitbook.com/content/urdqk4sHwHHpr4J3s5P6/blobs/7ZnYvETOTYFe56ZElWOS/Screenshot_2.png" alt=""><figcaption></figcaption></figure>

<figure><img src="https://content.gitbook.com/content/urdqk4sHwHHpr4J3s5P6/blobs/H93hgW2U5hUA9oEEa3ix/Screenshot_3.png" alt=""><figcaption></figcaption></figure>

* **Start inviting.** Share your referral link with your friends, partners, and via your social networks. Everyone who signs up using your link will become your referral and start bringing your earnings.
* **Get earnings.** Each time your referral purchase one or multiple 3rdDimension licenses — you earn 20% from the payment sum, including any discounts.
* **Expand your network.** The more you share, the more you earn. Continue sharing your referral link with your network to keep the earnings coming.

### **Referral Program Details:**

{% hint style="info" %}
The minimum amount of earnings, that can be withdrawn is $101.

* For up to $100, you can purchase a license with your Third Dimension referral balance.

* For more than $100, you can buy a license with a 2x value of your balance or withdraw your profits.
  {% endhint %}

* To ask for withdrawal or payment in honor of a personal 3rdDimension license, please contact 3rdDimension Support via live chat on the official website, email <support@thirddimension.exchange>, [telegram chat](https://t.me/ThirdDimensionSupport).

* All customers can participate, and each customer can invite as many friends as they want! There is no limit to the number of referrals one account can have.

* Customers cannot invite themselves to earn rewards using multiple accounts. Once this behavior has been detected, you will be disqualified from the Referral Program and all unpaid earned or accrued referral rewards will be canceled immediately.

* Customers cannot invite accounts owned or controlled by existing customers. Once this behavior has been detected, you will be disqualified from the Referral Program and all unpaid earned or accrued referral rewards will be canceled immediately.

* 3rdDimension reserves the right to modify the rules or rewards of this Referral Program at any point by publishing an updated set of program information.


# General Settings

Here are the articles in this section:

<table data-card-size="large" data-column-title-hidden data-view="cards"><thead><tr><th data-card-target data-type="content-ref"></th></tr></thead><tbody><tr><td><a href="/general-settings/3rd-dimension-main-toolbar">3rd Dimension Main Toolbar</a></td></tr><tr><td><a href="/general-settings/workspaces">Workspaces</a></td></tr><tr><td><a href="/general-settings/single-panel">Single Panel</a></td></tr><tr><td><a href="/general-settings/link-panels">Link panels</a></td></tr><tr><td><a href="/general-settings/binds">Binds</a></td></tr><tr><td><a href="/general-settings/group-of-panels">Group of panels</a></td></tr><tr><td><a href="/general-settings/templates">Templates</a></td></tr><tr><td><a href="/general-settings/set-as-default">Set as Default</a></td></tr><tr><td><a href="/general-settings/symbols-lookup">Symbols lookup</a></td></tr><tr><td><a href="/general-settings/table-management">Table management</a></td></tr><tr><td><a href="/general-settings/alerts">Alerts</a></td></tr><tr><td><a href="/general-settings/general-settings">General settings</a></td></tr><tr><td><a href="/general-settings/custom-hotkeys">Custom hotkeys</a></td></tr></tbody></table>


# 3rd Dimension Main Toolbar

Get to know how to use and manage Main Toolbar that is a starting panel of all platform

**Main Toolbar** — is the main starting point of the platform, used as a launcher and informer simultaneously.

<figure><img src="https://content.gitbook.com/content/urdqk4sHwHHpr4J3s5P6/blobs/cCGMrOjxLgJpPYzxSkcX/main%20toolbar.png" alt=""><figcaption><p>3rd Dimension Main Toolbar</p></figcaption></figure>

Main Toolbar technically is a panel, but behaves something differently: it can be dragged among your screens (if you have more than one) and it will be always stuck at the top of the screen. It adapts own width up to the screen width and it participates in the workspace, meaning, that other panels can be stuck to it.&#x20;

<figure><img src="https://content.gitbook.com/content/urdqk4sHwHHpr4J3s5P6/blobs/xBjXFIwGgc7sPiQY6oRW/assets_-LD6FsRvQ3jgwJIg6O7r_-MMGj88Vx9SrRX_AaoBl_-MMGjDjrhb757QMFzIco_main%20toolbar.jpg" alt=""><figcaption></figcaption></figure>

In this guide you will learn about the next functionalities:

* [**How to customize the Main Toolbar**](#customization-of-main-toolbar)
* [**Main menu with all panels**](#main-menu-with-all-panels)
* [**How to add Favorite Panels on the Toolbar**](#favorite-panels)
* [**How to Lock Trading**](#lock-trading)
* [**How to create and manage your Workspaces**](#workspaces-manager)
* [**Managing trading connections**](#favorite-connections)
* [**Sidebar with all Notifications**](#notifications-center)
* [**Platform's General Settings**](#general-settings)
* [**Time & Time Zones**](#time-and-time-zones)

Due to the fact that Toolbar is the main controlling panel it has the ability to collapse all platform’s interface by clicking the “***Minimize***” icon. This action makes all application panels collapse to the taskbar and literally disappear from your screens; it affects all panels on all screens.

The “***Close***” icon just closes the platform. You may set up the “*not to ask to confirm the closing*” setting in the pop-up screen while the first closing.

### Customization of Main Toolbar

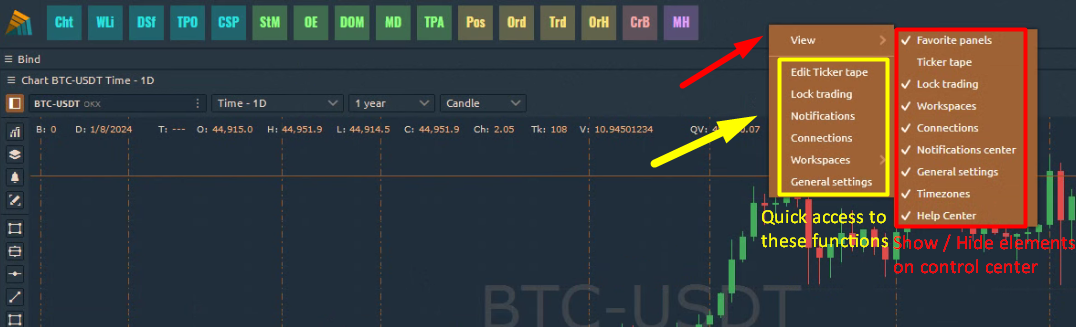
For optimal use of the space on the Main Toolbar, we have added the ability to display/hide some controls. For example, to hide the Timezones, Workspaces, Connections, etc., **Right-click** on the context menu and go to the View section. By clicking on the ticks, the controls will appear at the Toolbar.

<figure><img src="https://content.gitbook.com/content/urdqk4sHwHHpr4J3s5P6/blobs/RUfS8Jcr69Do03IemV41/toolbar%20view.png" alt=""><figcaption><p>Right click on the Main Toolbar will bring up the additional settings window</p></figcaption></figure>

### Main Menu with all panels

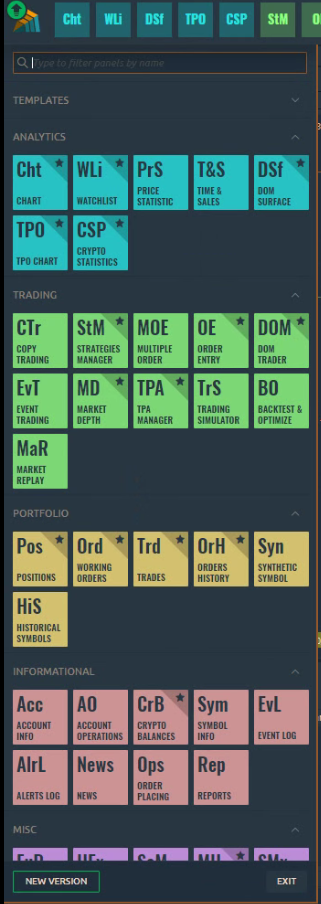
All of the panels are placed in the *“Sidebar”* screen, which is popping out once you click the **Logo icon** on the toolbar. The Main Menu consists of panel icons, grouped by functionality. Actually, in this menu, you can find all panels.

<figure><img src="https://content.gitbook.com/content/urdqk4sHwHHpr4J3s5P6/blobs/FvBXTHcZ63EdFAMSlPvA/sidebar.png" alt=""><figcaption><p>Main menu in the 3rd Dimension platform</p></figcaption></figure>

Each group in this menu can be collapsed in order to make the panels list cleaner. From this place, you can open any panel by left-clicking on its icon. Each group has its color to help you determine the functional assignment of each panel.

The footer of the Main Menu contains several functions:

* “**About**” link: opens a screen with information about terminal (version, rollback, updates checker etc.). If the system detects the new version of 3rd Dimension, the **“NEW VERSION”** button appears instead of this link;
* “**Exit**” button closes the application.

{% hint style="info" %}
The list of links in footer can contain more or fewer items, depending on current application requirements.
{% endhint %}

### Favorite panels

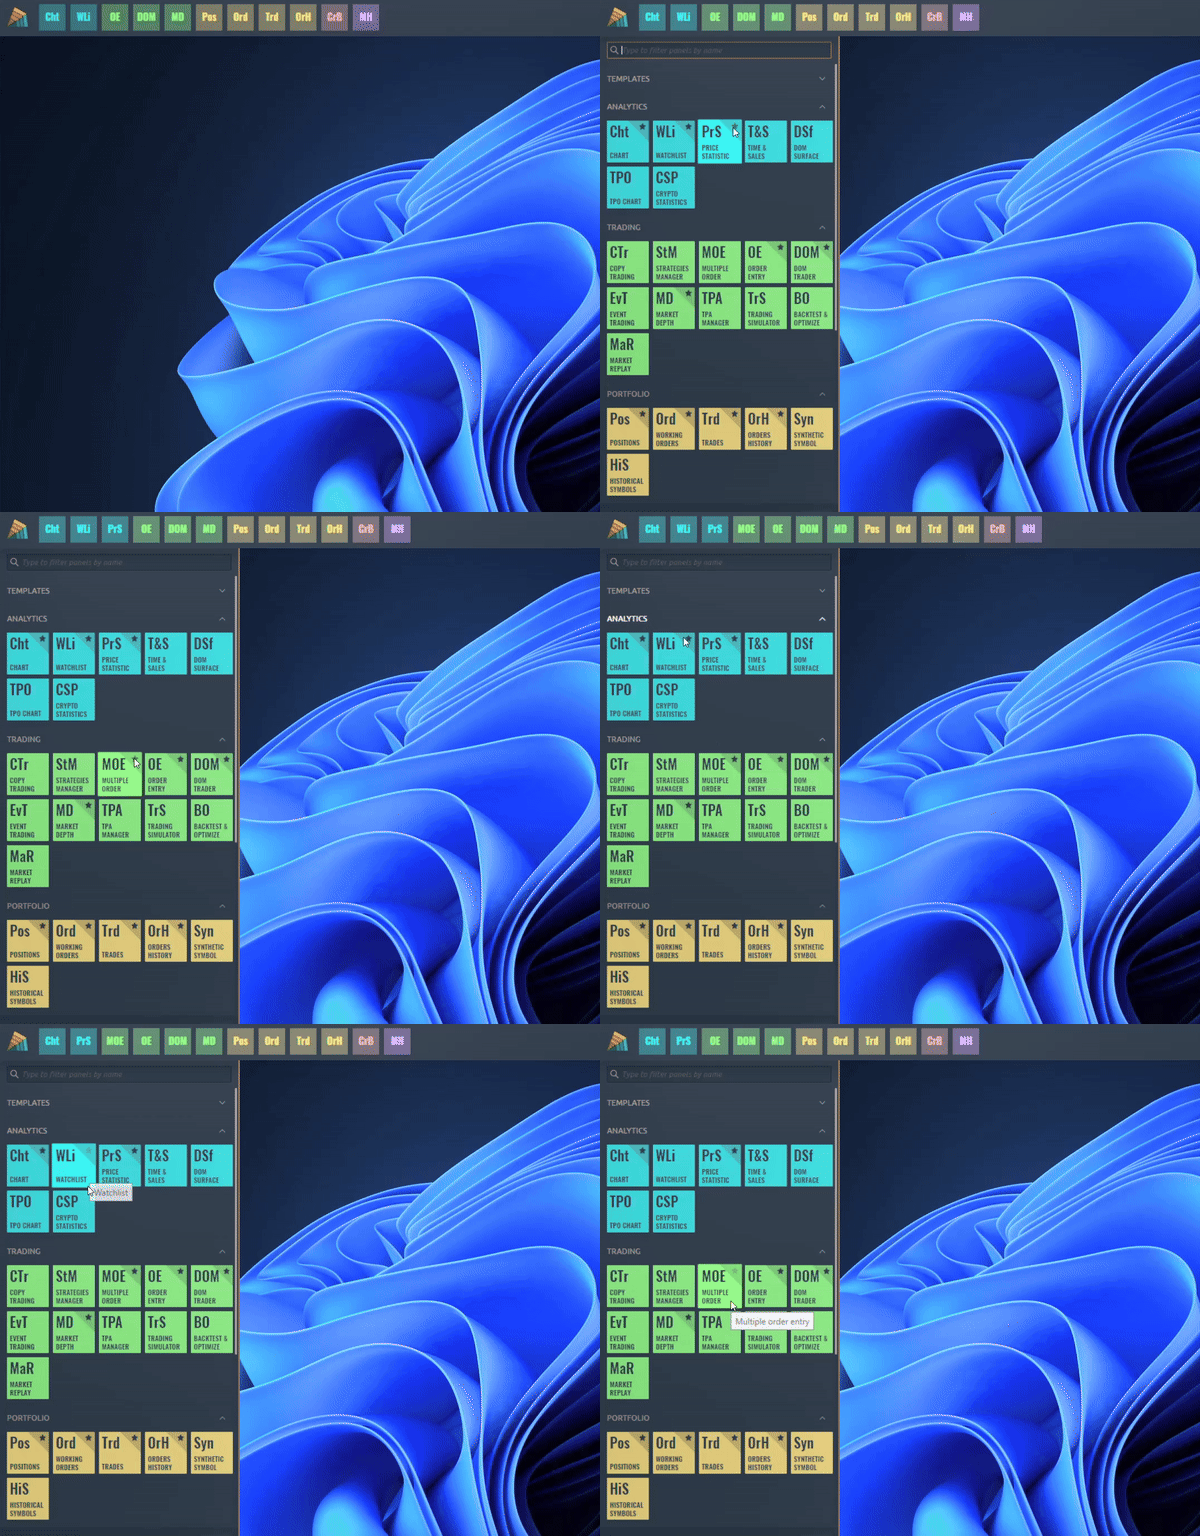
You might already have seen the Star icon in the right top corners of some panels tiles in Sidebar. This is the “**Favorite panels**” functionality, allowing you to select the most usable panels and place their icons on the Main Toolbar.

<figure><img src="https://content.gitbook.com/content/urdqk4sHwHHpr4J3s5P6/blobs/RJJQqpjGQheVVmg5uiMZ/pin-ezgif.com-video-to-gif-converter.gif" alt=""><figcaption><p>Favorite panels</p></figcaption></figure>

The way to use it is very simple — hover over the right top corner of any panel tile in Sidebar and click the Star icon that appeared. That is all: a panel appears in the Favorite panels bar in Main Toolbar. To remove from favorites just click the activated Star icon on Panel's tile or right-click on the icon in Favorites panel and select “***Hide from toolbar***”.

### Lock trading

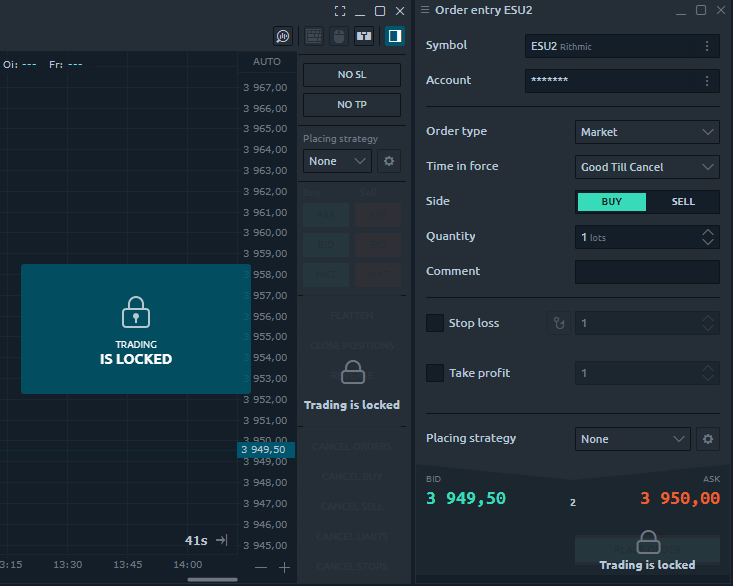
If you would like to prevent manual trading operations occur, you may use the “***Lock trading***” button on Main Toolbar. Once clicked it displays the confirmation message that trading is locked and all of the functions, related to the opening or closing orders and positions will be disabled. Unlock trading can be done the vice-versa way.

<figure><img src="https://content.gitbook.com/content/urdqk4sHwHHpr4J3s5P6/blobs/oT1VlPfaJi0j0Oyx7TAI/locktrading.png" alt=""><figcaption><p>Lock Trading Icon</p></figcaption></figure>

<figure><img src="https://content.gitbook.com/content/urdqk4sHwHHpr4J3s5P6/blobs/9QSbGBs1YFHLW52feVnN/spaces_-lock.webp" alt=""><figcaption><p>All trading buttons are locked</p></figcaption></figure>

This feature is useful in case you would like to only analyze the market or while editing your workspace (mostly to avoid misclicks).

### Workspaces manager

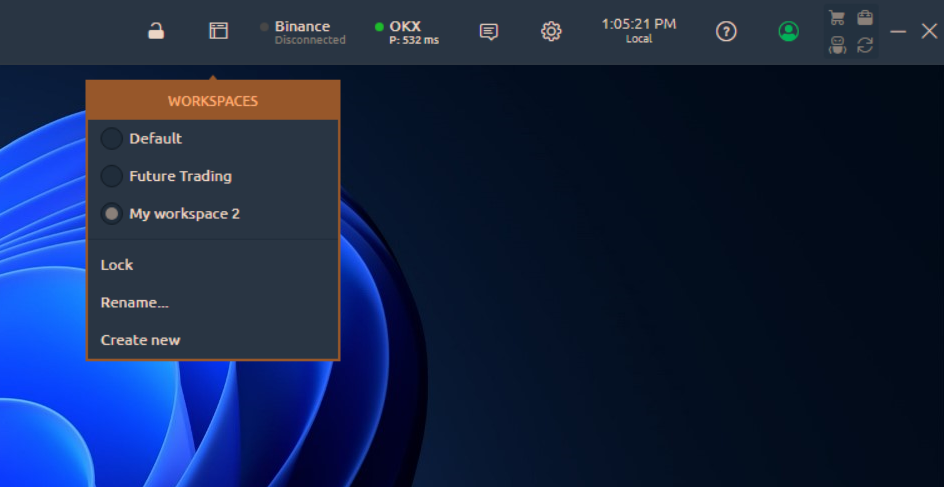
**Workspaces manager** allows you to see, create, edit and delete your working environments as well as lock their modification. It is represented with the special icon, that opens the list of available Workspaces once being clicked.

<figure><img src="https://content.gitbook.com/content/urdqk4sHwHHpr4J3s5P6/blobs/kQL9X3T0fJ6X3bkqmdEf/workspace.png" alt=""><figcaption></figcaption></figure>

The currently active workspace is marked with the color and has a blue dot on the left side of its name. You can switch the current workspace by left-clicking any of the available items from the list. The bottom part of the list (after separator) consists of actions, referred to the currently active workspace and allows to:

* **Lock** — disables an ability to add, remove, move or resize any panel in current workspace;
* **Rename...** — invokes a pop-up screen where you can set up a new name for the current workspace;
* **Create new** — opens a pop-up screen with the new workspace creation form.

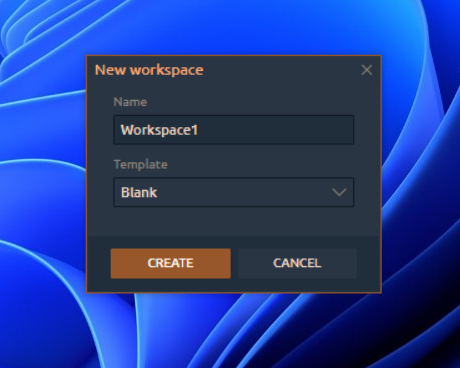
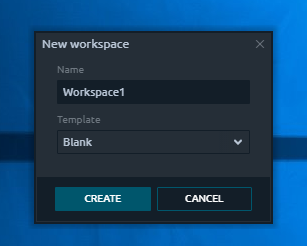
<figure><img src="https://content.gitbook.com/content/urdqk4sHwHHpr4J3s5P6/blobs/EIZHYgokOtGboSrSf477/new%20work%20space.png" alt=""><figcaption><p>New workspace creation window</p></figcaption></figure>

When creating the new workspace, you have an ability to specify its future name and select whether it should be Blank, once created, or should contain some predefined panels set.&#x20;

You can also remove any of Workspaces by clicking the “***Trash***” icon on the right side from Workspace name (icon appears while hovering the name).

### Favorite connections

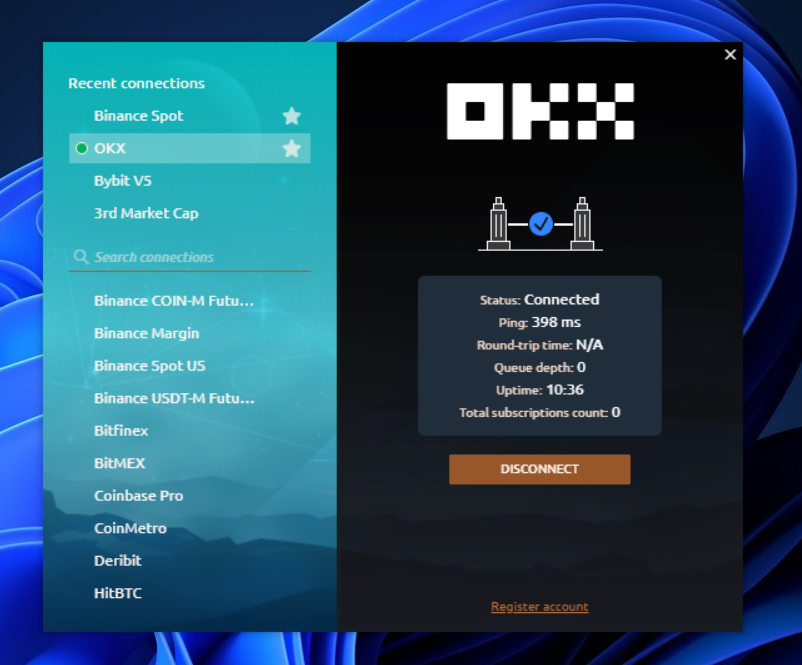
The list of active connections can be seen on Main Toolbar in Favorite connections block. By default, you will see several items here, each representing one of the available connections. The [Connection manager](/connections/connections-manager) screen will be opened by clicking any of the items in Favorite connections block.&#x20;

<figure><img src="https://content.gitbook.com/content/urdqk4sHwHHpr4J3s5P6/blobs/zKftcHs2Oe65r7mIxZzw/connection%20manager.png" alt=""><figcaption><p>Add favorite connections by clicking the "Star" icon</p></figcaption></figure>

In order to show some connection on this bar, you need to click a “***Star***” icon at the right side of connection name in Connections manager panel. Click once more, and the connection will be removed from Favorites bar.

Being added to Favorites bar, each connection will be displayed as a tile, containing some vital info:

* **Connection name**
* **Status text** (can be a status message or Ping time in ms when the connection is active)
* **Status Dot**, a visual representation of connection status. Can be grey (disconnected), yellow (connecting), green (active).

You can remove a connection from Favorites by right-clicking on it and selecting “***Hide from toolbar***” item. Here you can also ask to connect or disconnect.

### Notifications center

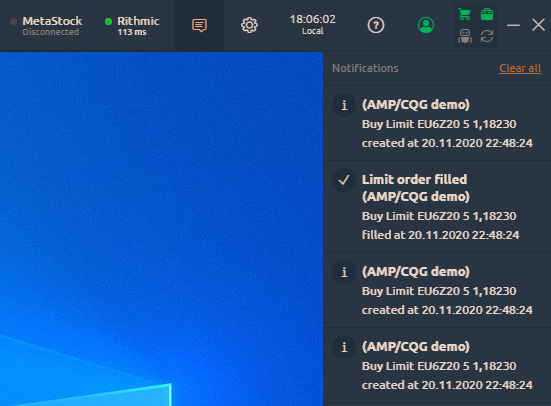
Most actions during the platform use generate various notifications. There can be system notifications (some connection problems or errors) and Deal tickets.&#x20;

The **Deal tickets** — are the notifications about the trading operations. Each time you create an order or opening a new position — we will create a deal ticket for this.&#x20;(you can [disable deat tickets in general settings](/general-settings/general-settings#control-center))

While some trading actions may be done in one click at the first sight, they usually consist of several related operations, each of them will be displayed via the Deal tickets. That is why you can see much more items in Notifications center than you did actions.&#x20;

The **Notifications center** — is the place where all notifications are stored in one list. You can open that list by clicking the Notifications icon in Control center.&#x20;

<figure><img src="https://content.gitbook.com/content/urdqk4sHwHHpr4J3s5P6/blobs/ydwajewvpbJTwuBNg5Yx/image.png" alt=""><figcaption><p>Notifications center</p></figcaption></figure>

When you have a set of new notifications, the small number will appear in the left top corner of Notification center icon. It displays how many unread notifications you have. Once you open the list — it understands that you have read them and the number will disappear.&#x20;

You will see all notifications just from the platform start. You may also clear this list by clicking the “***Clear all***” link. This action will hide all of the currently seen notifications from this list (but they will be still available in Event Log panel).

By clicking one of the notifications you will see the window with the detailed info.

### General settings

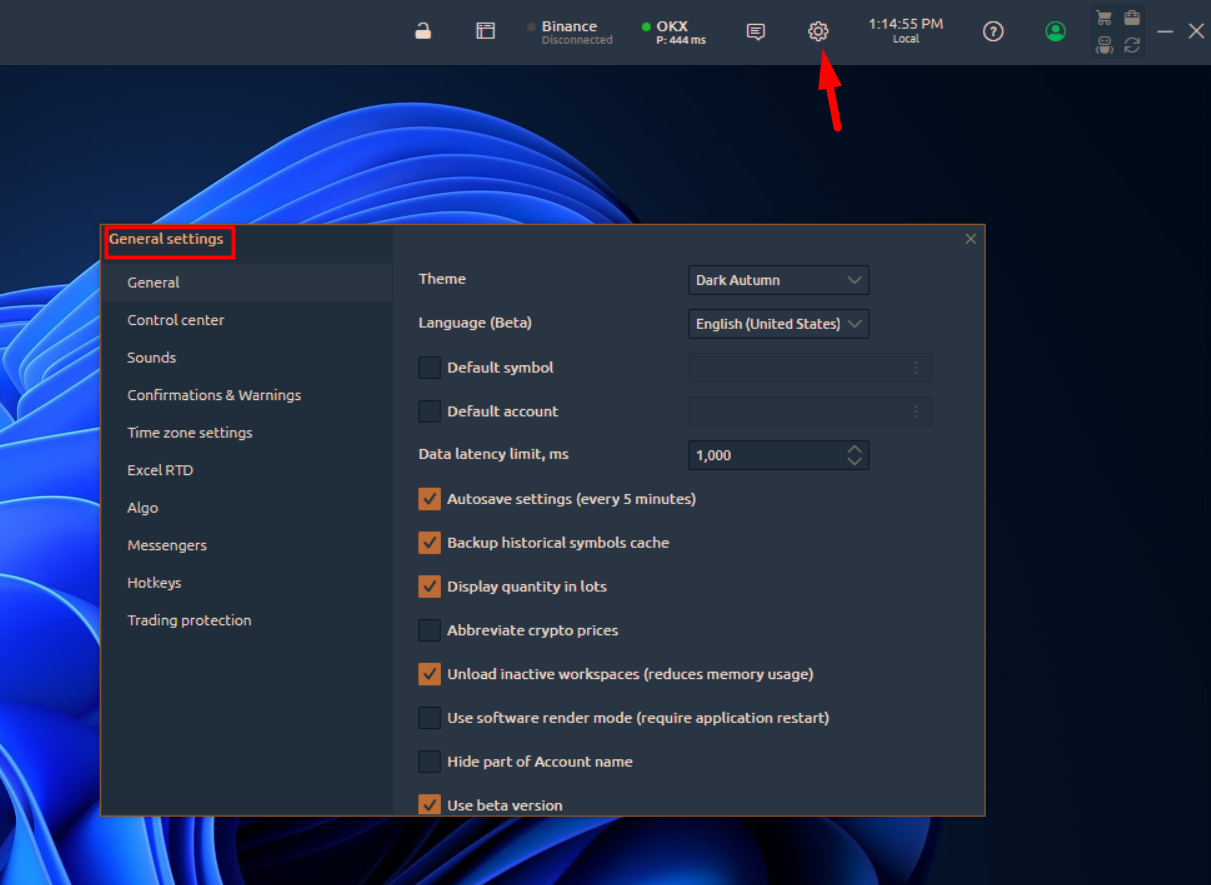
The “***Gear***” icon opens a general settings screen, where you can set up the most common parameters of our terminal. [More details about the **Settings**](/general-settings/general-settings) screen are available in the corresponding section of this documentation.

<figure><img src="https://content.gitbook.com/content/urdqk4sHwHHpr4J3s5P6/blobs/NzemiVIJiUn7KgrleSQn/general%20settings.png" alt=""><figcaption><p>Access to general settings</p></figcaption></figure>

### Time & Time zones

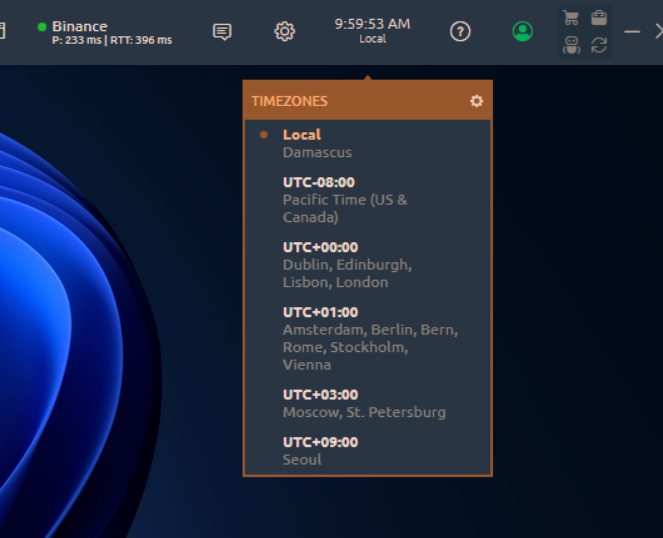
The Time bar is also displayed on the Main Toolbar toolbar showing you time in the selected timezone. By default, your local timezone is used. You can change the time zones list by clicking the "***Gear***" icon and then select the required ones in [**General settings screen**](/general-settings/general-settings#time-zones). You may also select several time zones and they will appear as a list in a drop-down panel, allowing you to switch among them quickly.

<figure><img src="https://content.gitbook.com/content/urdqk4sHwHHpr4J3s5P6/blobs/OHrL7BzXiIsrycAEAkjH/timezones.png" alt="" width="497"><figcaption><p>Switch between your favorite timezones</p></figcaption></figure>


# Workspaces

Create the best trading environment, based on your own preferences. Use panels, Binds, and Groups under one Workspace

The highest level of trading area organization — is a **Workspace**. This is the most general grouping layer that you may even don’t need most of the time.

{% hint style="success" %}
3rd Dimension **automatically saves** every workspace into a local file **every five minutes** and right **before you exit** your app without requiring any manual action from the user. Additionally, you can press **Ctrl+S** to save your currently active workspace manually.
{% endhint %}

As a top-level grouping layer, Workspaces store all their contents in special local files. These files can be found in ***3rd Dimension-> Settings -> Workspaces*** folder. Each file represents some workspace; both have the similar names. Technically, the workspace file is an XML-document containing all of the settings of all panels that are in the workspace.

{% embed url="<https://www.youtube.com/watch?v=qFyYV4yZXac>" %}
How to create and save your custom workspace
{% endembed %}

**Workspaces manager** allows you to see, create, edit and delete your working environments as well as lock their modification. It is represented with the special icon, that opens the list of available Workspaces once being clicked.

<figure><img src="https://content.gitbook.com/content/urdqk4sHwHHpr4J3s5P6/blobs/kQL9X3T0fJ6X3bkqmdEf/workspace.png" alt="" width="563"><figcaption><p>Workspaces manager</p></figcaption></figure>

The currently active workspace is marked with the color and has a blue dot on the left side of its name. You can switch the current workspace by left-clicking any of available item from the list. The bottom part of the list (after separator) consists of actions, referred to the currently active workspace and allows to:

* **Lock** — disables an ability to add, remove, move or resize any panel in current workspace;
* **Rename...** — invokes a pop-up screen where you can set up a new name for the current workspace;
* **Create new** — opens a pop-up screen with the new workspace creation form.

<figure><img src="https://content.gitbook.com/content/urdqk4sHwHHpr4J3s5P6/blobs/9ZgFAvmKbWNoPZNMZMEi/image.png" alt=""><figcaption><p>New workspace creation window</p></figcaption></figure>

When creating the new workspace, you have an ability to specify its future name and select whether it should be Blank, once created, or should contain some predefined panels set.&#x20;

{% hint style="success" %}
The list of Workspace templates will be constantly growing.&#x20;
{% endhint %}

You can also Remove any of Workspaces by clicking the “***Trash***” icon on the right side from Workspace name (icon appears while hovering the name).


# Single Panel

Single panel is the minor element of any Workspace and they behave just like any usual PC window

Standalone panels are the minor elements of any Workspace and they behave just like any usual PC window:

* can be resized and positioned to any place on your screen;
* can stick to each other within their borders when they close enough;
* can stick its size to repeat the dimensions of other panels, while resizing;
* can be collapsed to the OS taskbar as usual windows

### Panel's context menu

Each panel has its **context menu**, located in the left upper corner, right before the Panel’s title.

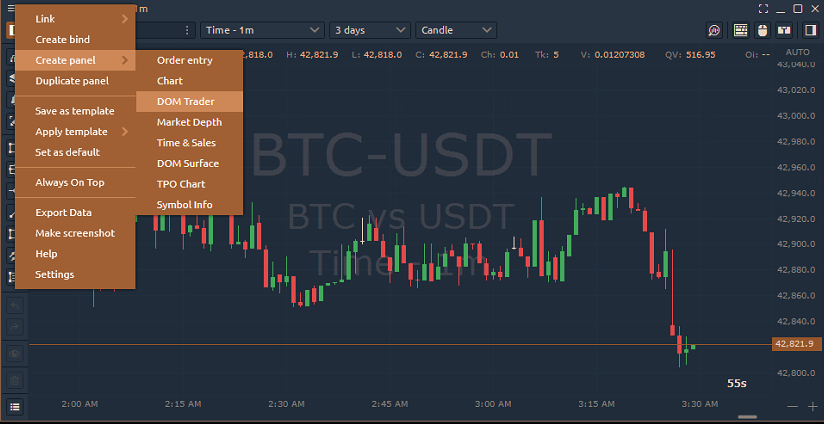
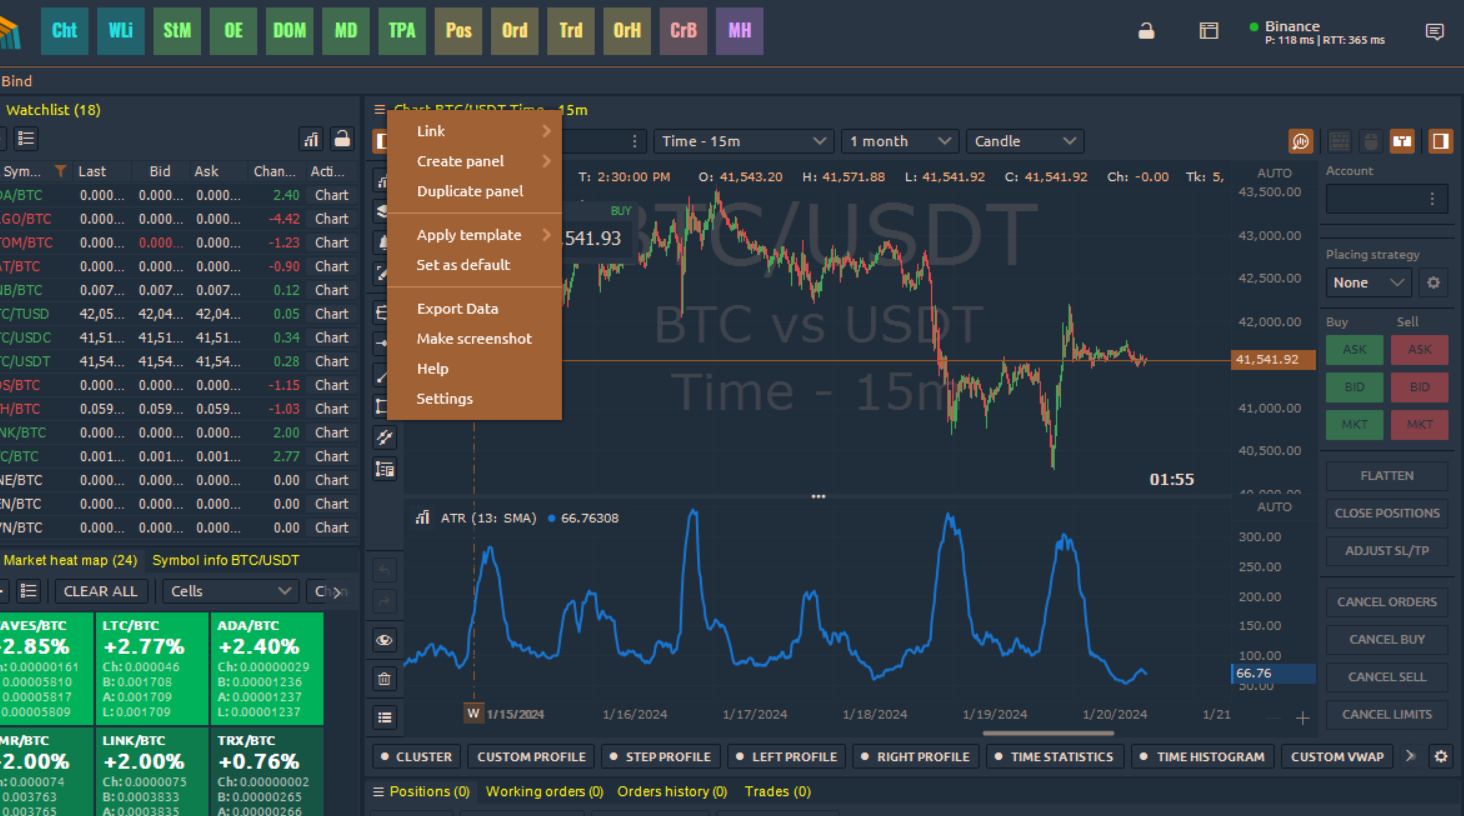
<figure><img src="https://content.gitbook.com/content/urdqk4sHwHHpr4J3s5P6/blobs/1ZOV1uWZps7DwD6O7Mmn/context%20menu.png" alt=""><figcaption></figcaption></figure>

This menu usually consists of the following functions:

* **Link**. Allows linking multiple panels by common symbol using the Color definition. More details are in the [***Linking section***](/general-settings/link-panels)**.**
* [**Create Bind**](/general-settings/binds). Combine multiple panels into a Super-panel. More details are in the [***Binds section***](/general-settings/binds).
* **Create Panel.** Open a new panel with the current symbol.\
  You can open the following panels: [**Order Entry**](broken://pages/-LEAsY9m3bNqzhIdr7hO)**,** [**Chart**](broken://pages/-LEAsY9XjZAYQ33q3RGP)**,** [**DOM Trader**](broken://pages/-LEAsY9na-sjbhOLg-0M)**,** [**Market Depth**](broken://pages/-LEAsY9oqHeJ0G6YIjSu)**,** [**Time\&Sales**](broken://pages/-LEAsY9jYbfqjt1bo1v3)**,** [**DOM Surface**](broken://pages/-Lq_aYtpGtdPDadUDaXf)**,** [**TPO Chart**](broken://pages/-Lt0LhDCL6N18J_MfNW9)**,** [**Symbol Info**](broken://pages/-LEAsYA-09VbvTJcpXjJ)
* **Duplicate Panel**. Create an exact copy of the current panel.
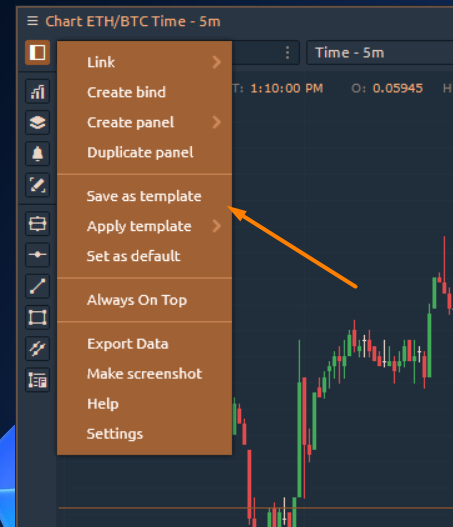
* [**Save as Template**](broken://pages/-LHDWRg7U8MLzSaKtFBg). Customize the panel, combine it in a group, or Bind and save it as a template.
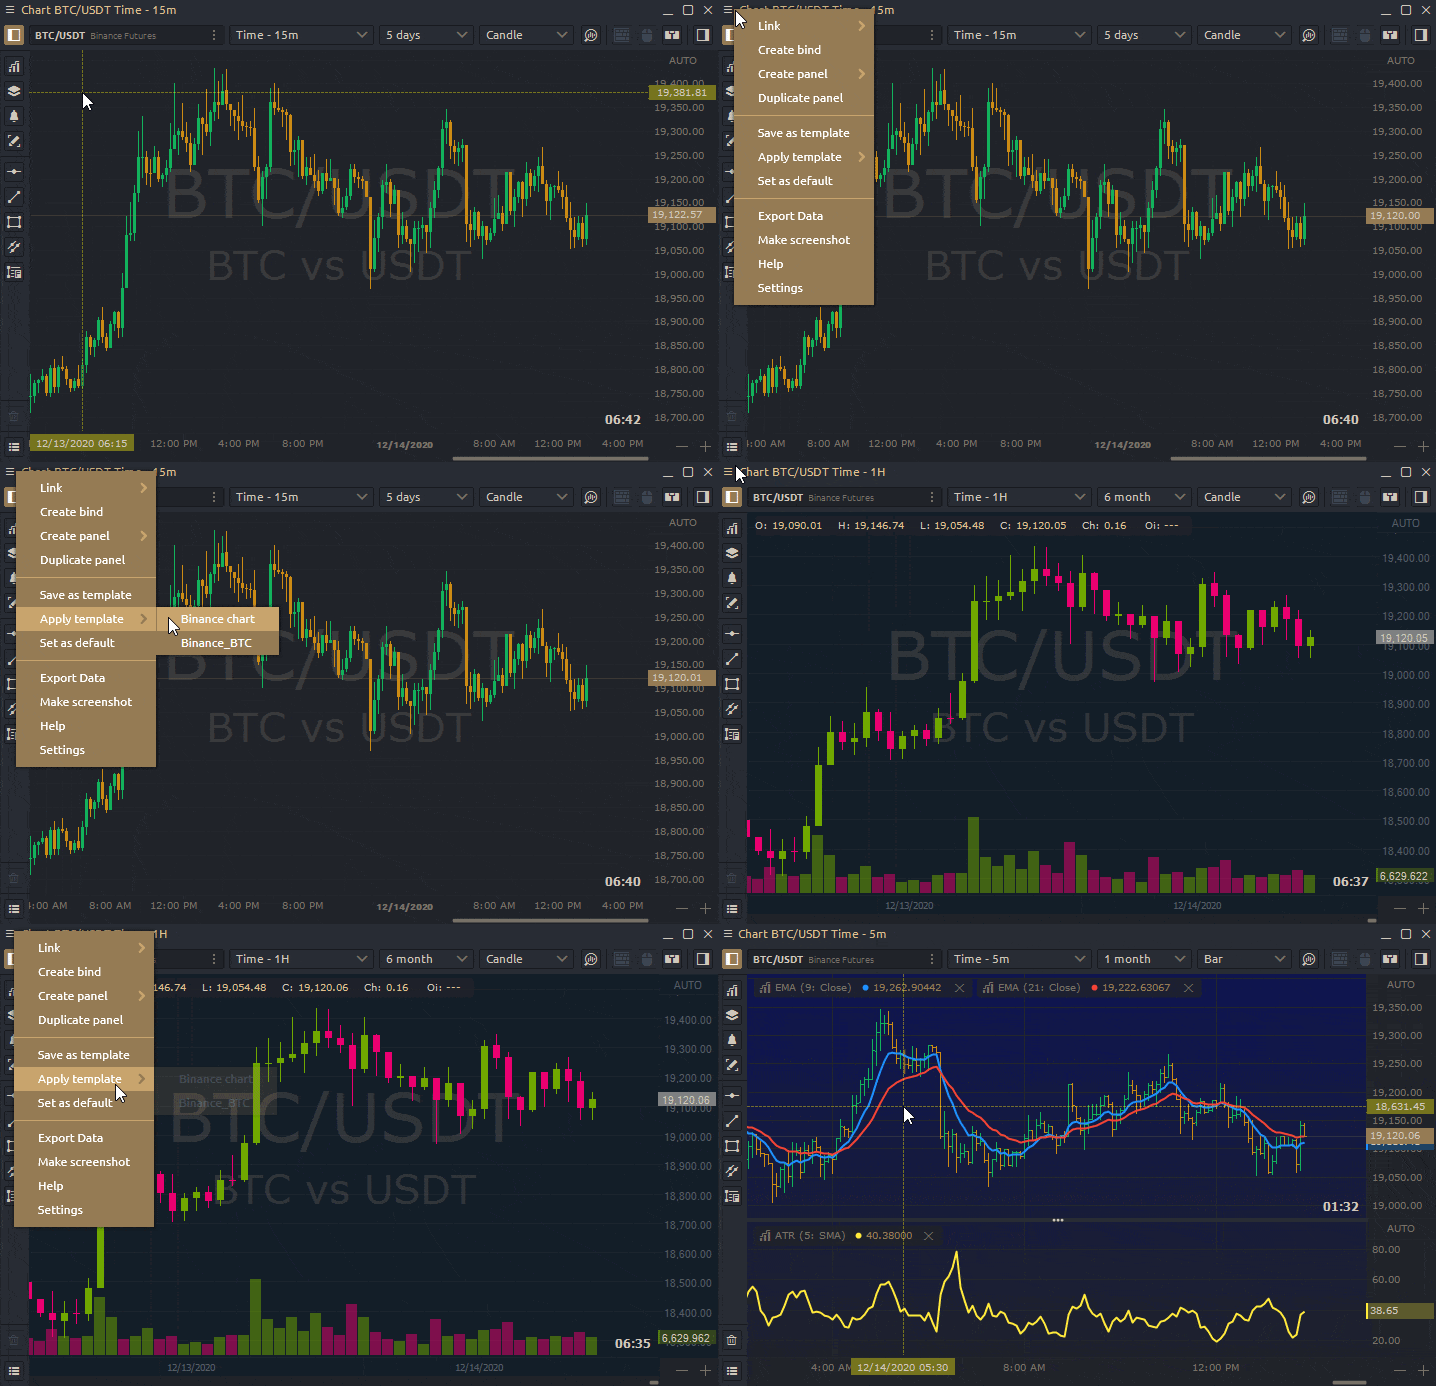
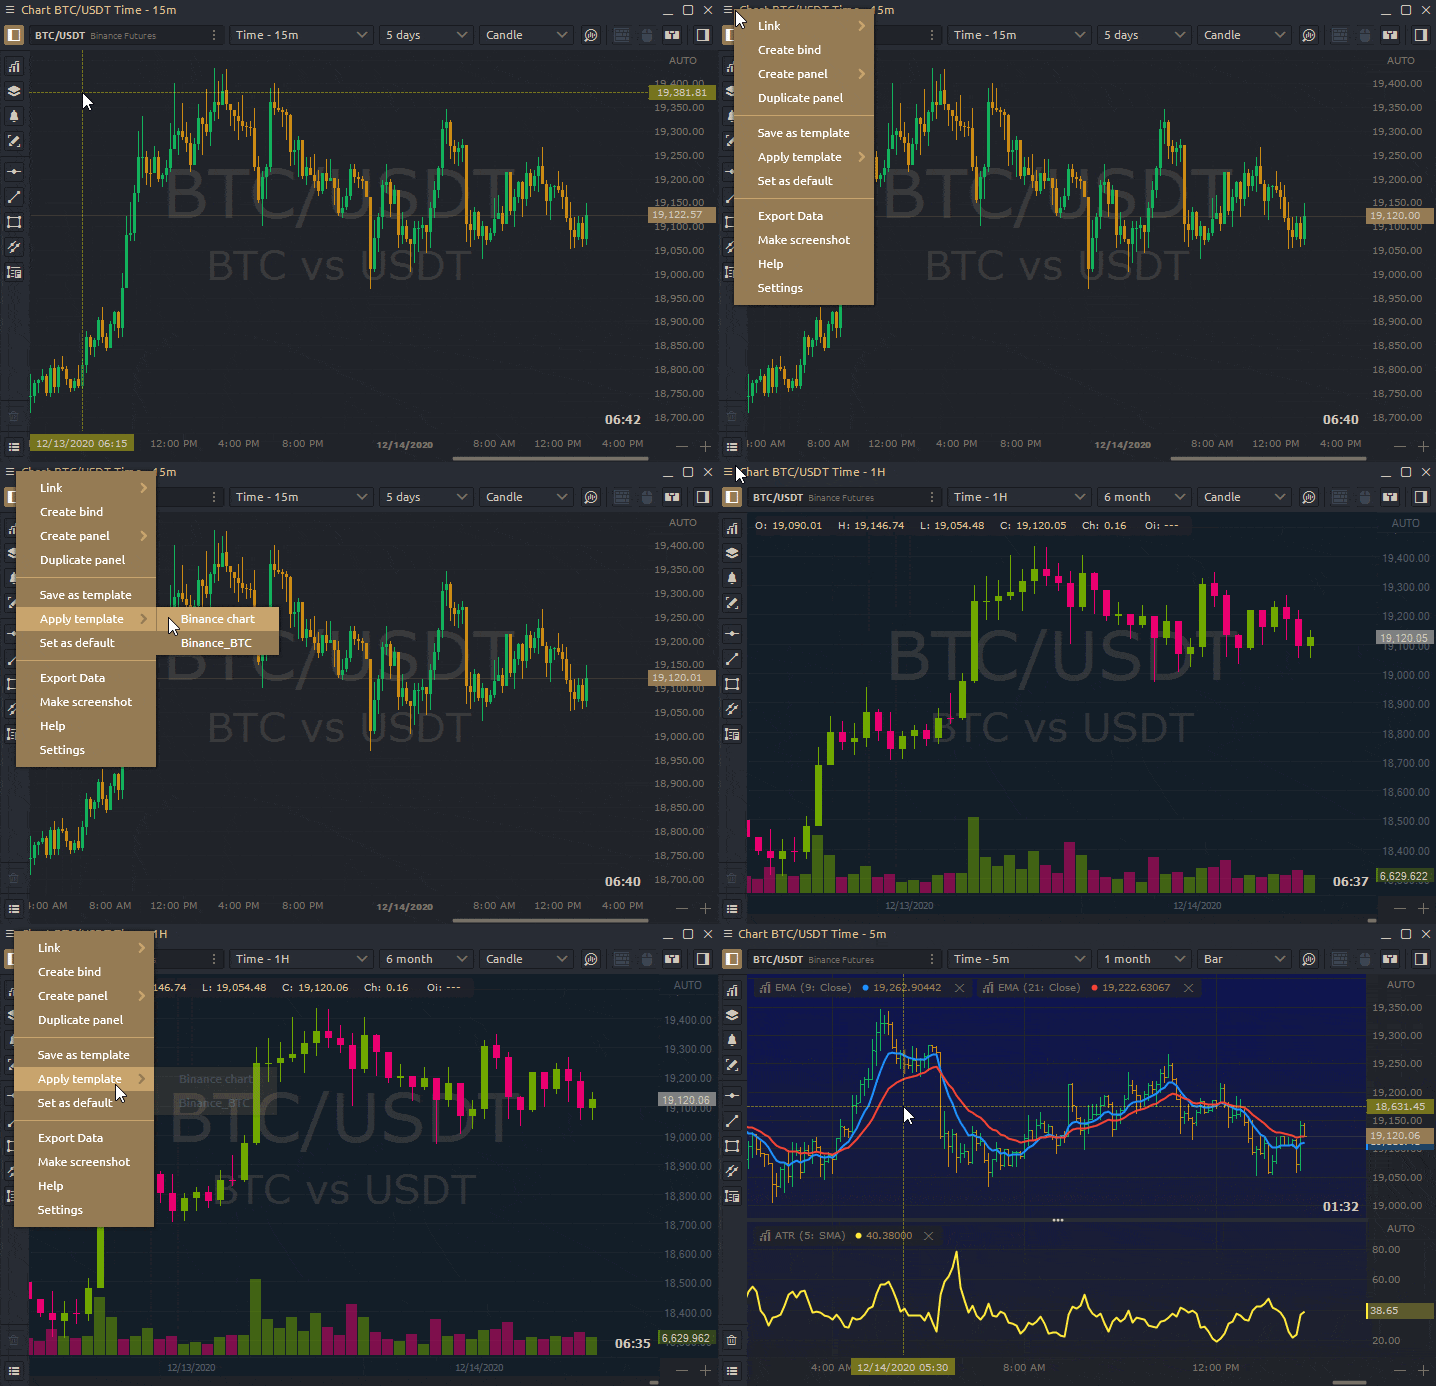
* **Apply Template.** Once you created several templates you can apply any of them to this particular panel.

<figure><img src="https://content.gitbook.com/content/urdqk4sHwHHpr4J3s5P6/blobs/JvctpvysiKwhu1SQbuj7/templates.gif" alt=""><figcaption></figcaption></figure>

* [**Save as default**](broken://pages/-LSUJJKjUO1bAWd1xq19)**.** Each panel type comes with default settings, which you can customize to your preference. Select the “*<mark style="background-color:green;">**Set as Default**</mark>*” option, and Quantower will save your current panel's settings, applying them to each new panel of the same type.
* [**Setup Actions**](broken://pages/-MLw5qfPKhTan_mwZd-c) (only for table panels like Watchlist, Time & Sales, Positions, Working Orders etc.). This feature allows you to set Alerts and implement advanced filtering in table values.
* **Always of Top.** When activated, the '*<mark style="background-color:green;">**Always On Top**</mark>*' feature keeps the active panel above all other panels. The pinned panel remains on top, even when other panels are selected.
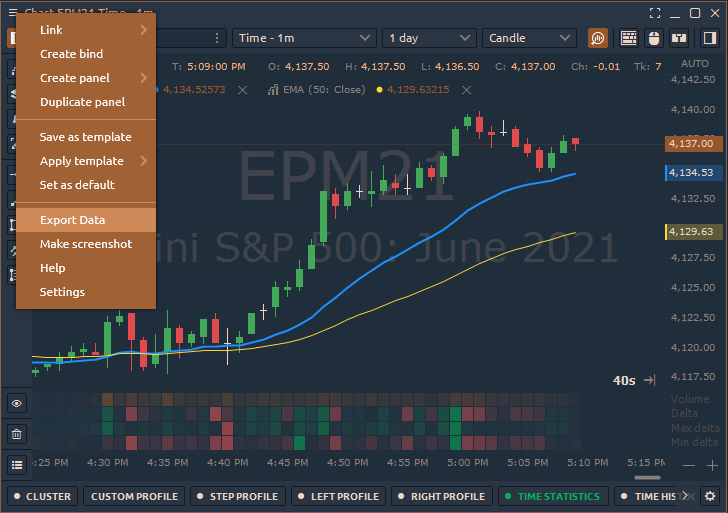
* [**Export Data.**](broken://pages/-LEAsYA5-s6bfIUnO6gK#how-to-export-historical-data-via-other-panels) Export data from a chart or table to an external CSV file. This includes price data, indicator values, and table values. Also, you can use the [**HISTORY EXPORTER**](broken://pages/-LEAsYA5-s6bfIUnO6gK) panel.

<figure><img src="https://content.gitbook.com/content/urdqk4sHwHHpr4J3s5P6/blobs/yGBK6iG2xnfJAcDjmAye/image.png" alt=""><figcaption></figcaption></figure>

* **Make Screenshot.** Creates and copies a screenshot of the panel to the clipboard for easy sharing on social networks.
* **Help**. If you have questions about using the panel or its specific features, click on this link and you will immediately redirect to the documentation for this panel.
* **Settings**. Personal settings for each panel. Opens a Settings screen where you can customize your panel. Once set up, you can save these settings as your Defaults if desired.


# Link panels

Set the same color for multiple panels for applying Linking.

**Link** allows linking several panels by common symbol using the Color definition. Just select one link color in two panels and they will have a synchronized symbol parameter. Once linkage is applied, the panel’s title will be colored to the respective color.

<figure><img src="https://content.gitbook.com/content/urdqk4sHwHHpr4J3s5P6/blobs/AMiGQq2uWrwtI1xntQz8/link11-ezgif.com-video-to-gif-converter.gif" alt=""><figcaption></figcaption></figure>


# Binds

Binds allow to create any combination of panels in any required way

The most innovative and, we are sure, a useful layer of panels organization — is **Binds** (binding). It was developed to allow a user to create its own “**Super-panels**” — the sets of basic panels that should be stuck together. Generally, Binds allows you to create any combination of panels in any required way; the only limit is your fantasy.

### How to Bind several panels

1. place several panels on your workspace close to each other;
2. select “***Create bind***” from any panel’s context menu (this turns the Bind mode on);
3. click on the panels, that you want to bind together or just hold the left mouse button and drag ("draw") over that panels to make them selected in one area;
4. press “***CREATE BIND***” button in the right-bottom corner of the Bind area (or hit “Enter” button on your keyboard);&#x20;
5. that is all — now you have your own Super-panel.


# Group of panels

Group allows to arrange several panels as nested tabs and then move the created group as one panel.

The simplest level of combining several panels together is a **Group**. This layer allows to arrange several panels as nested tabs and then move the created group as one panel.&#x20;


# Templates

Customize the panel as you need and save it as a Template for quick use for other trading instruments

Due to the wide list of features, most panels in 3rd Dimension platform have a huge list of customization possibilities. The more powerful panel is — the more settings it has. This allows any user to tune each functionality on its own and sometimes this process can take a lot of time to complete.

In order to save your work on workspace customization, we have developed a ***“Templates”*** functionality. It helps you to save your customizations in special objects — templates — and instantiate them later, keeping all of the applied settings.

You can ***save any*** [***Panel***](/general-settings/single-panel)***,*** [***Group*** ](/general-settings/group-of-panels)***or*** [***Bind*** ](/general-settings/binds)***as a template***, so its usefulness is very promising.

### How to create the template?

The process of Template creation is as simple as 1-2-3:&#x20;

1. Open any panel (or use Group / Bind)
2. Customize it according to your needs
3. Save as Template with a custom name.

<figure><img src="https://content.gitbook.com/content/urdqk4sHwHHpr4J3s5P6/blobs/zboNHCyeUhfTMRRe7a5t/save%20as%20template.png" alt=""><figcaption><p>“Save as template” option in panel’s context menu</p></figcaption></figure>

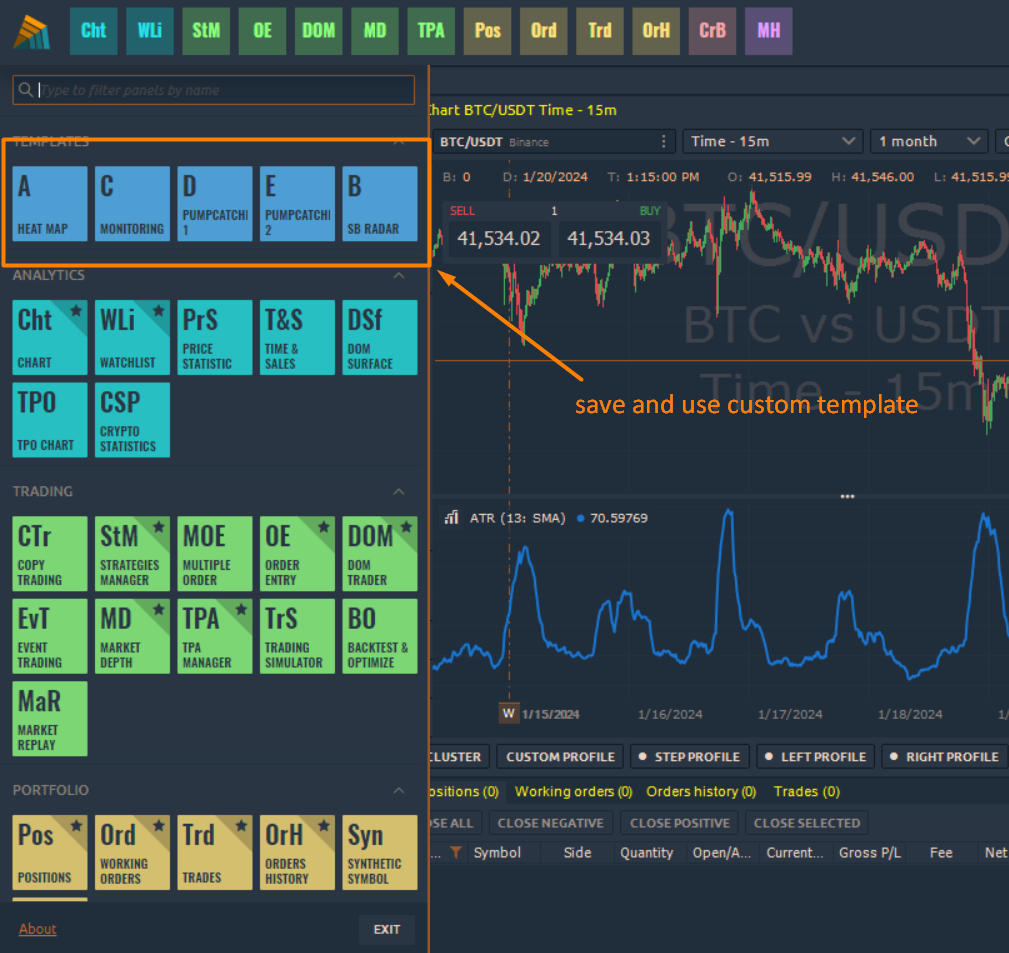
All of the created templates are stored in Control center sidebar, under the ***“Templates”*** group. So you can launch any template from this place any time you wish. You can put the saved templates on the Favorites bar of Control center, like any other default panel.

<figure><img src="https://content.gitbook.com/content/urdqk4sHwHHpr4J3s5P6/blobs/eVZq820Nrm3jBq5oExm1/template.png" alt=""><figcaption><p>Templates section in Control center sidebar</p></figcaption></figure>

**Apply template.** Once you created several templates you can apply any of them to this particular panel.

<figure><img src="https://content.gitbook.com/content/urdqk4sHwHHpr4J3s5P6/blobs/jiEZiXKOFTwCNktm5f1E/templates%201.gif" alt=""><figcaption></figcaption></figure>

If you want to **edit** the template name or **delete** it from your terminal — use the context menu on it. Each Template stores all of the settings data, including sizes, coloring, internal elements visibility, a predefined symbol of account values, additional specific settings etc. In other words: all that you can customize + more.

{% hint style="warning" %}
If the separate panel is in the Bind, the template saving cannot be applied to it. In this case, **the template can be saved only for Bind.**
{% endhint %}

<figure><img src="https://content.gitbook.com/content/urdqk4sHwHHpr4J3s5P6/blobs/N5YUhuQzQjbWPsKE0dCA/template2.png" alt=""><figcaption></figcaption></figure>

{% hint style="success" %}
You can **share your templates** with other 3rd Dimension traders by sharing the template files with them. Template files can be found in “3rd Dimension -> Settings -> Templates” folder.
{% endhint %}


# Set as Default

Set as Default option allows to customize the panel and save its settings by default. Each newly opened panel of this type will apply the saved settings.

Flexible platform settings allow you to customize any panel on your own. Change the font, color, add indicators, determine the displaying of the required columns in the table, etc.

But if you don’t want to configure the newly opened panels of this type every time, we have created the "***Set as Default*****"** option that redefines the factory settings.

## How Set as Default works? <a href="#how-set-as-default-works" id="how-set-as-default-works"></a>

* **Open the panel** for which you want to assign new settings.
* **Customize the panel**. For example, on the chart panel, add any indicator, change the font size of the price axis, change the background color.
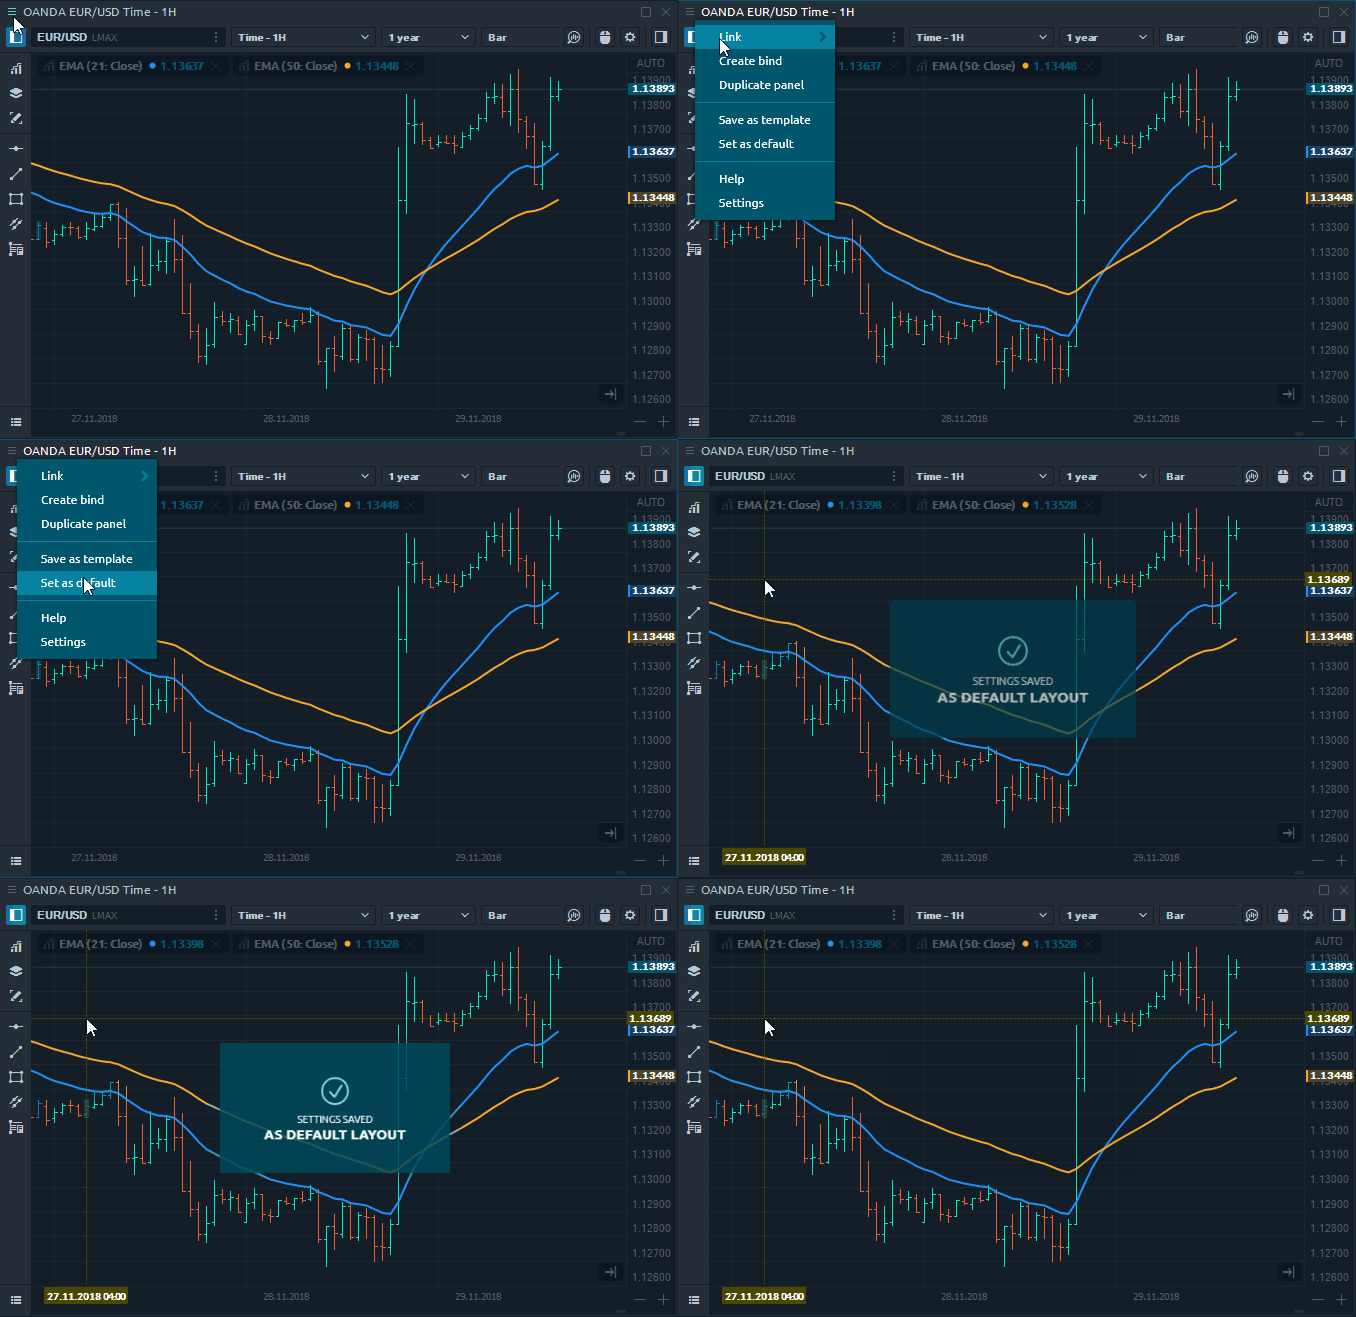
* Click on the panel's context menu (left upper corner) and click on the "***Set as Default"***. You will see the message "***Settings saved as default layout***".
* A new panel of this type will open with saved settings.

<figure><img src="https://content.gitbook.com/content/urdqk4sHwHHpr4J3s5P6/blobs/CrmlktD7cwdyvgzTcgog/set%20as%20default.gif" alt=""><figcaption><p>Saving settings as default</p></figcaption></figure>

{% hint style="info" %}
If you enable [***volume analysis tools***](https://help.quantower.com/analytics-panels/chart/volume-analysis-tools) on the chart panel and save it by default, then each new chart panel will be loading tick and volume data. It will increase traffic consumption and reduce the speed of building chart data.
{% endhint %}


# Symbols lookup

Symbols lookup manager allowing to search and select any available symbol from active connections

Symbols lookup manager — is a special screen, allowing to search and select any available symbol from active connections. There are various panels in 3rd Dimension terminal, that require to have a Symbol parameter being set up (Watchlist, Chart, Symbol info etc.). Depending on the requirements, symbols lookup can allow single or multiple symbols selection.

Each time you successfully connect with some integration, you will get a list of its symbols in Symbol lookup manager screen. Due to 3rd Dimension allows a multiple integrations connection, you may have several similar symbols with data, that can vary a bit. This is normal because different providers can give us different quotes data.

## Lookup field <a href="#lookup-field" id="lookup-field"></a>

Symbols lookup screen usually invoked from a lookup field. This field consists of two parts that allow you to open lookup screen:

* Symbol name (with connection name)
* “***Lookup***” icon in the form of three vertical points

![](https://blobscdn.gitbook.com/v0/b/gitbook-28427.appspot.com/o/assets%2F-LD6FsRvQ3jgwJIg6O7r%2F-LEodIDzmGvm_1cq-Zi6%2F-LEodZeuGTDWFyNcZANa%2FlookupField.png?alt=media\&token=f70a7af3-e6e7-4117-bce8-efbcdbc4f099)

Symbol lookup field

If you click on symbol name you will see that Lookup screen will pop up and the symbols, entered by you will be applied as filtering for the Symbols list.

If you click on “***Lookup***” icon you will see the popped up Lookup screen without any filtering applied to symbols list.

![](https://blobscdn.gitbook.com/v0/b/gitbook-28427.appspot.com/o/assets%2F-LD6FsRvQ3jgwJIg6O7r%2F-LZFsrT-K-_sZf_fFJEd%2F-LZFxHyNm8relwoGBUGZ%2FSymbol%20lookup%20screen.png?alt=media\&token=36096c34-fba5-4eef-9fec-656898c8e9e2)

Symbol Lookup screen

Anyway, you will get the Lookup screen, ready for Symbol selection. Lookup screen consists of three elements:

* Toolbar with Search field and filter
* The list of Connections and their symbols
* Footer section

If you want to close it just click outside of it.

## Searching & Filtering <a href="#searching-and-filtering" id="searching-and-filtering"></a>

Usually, each connection gives you a numerous list of trading Symbols to select from. If you know name, you can start typing it in “***Search field***”, and the below list will be instantly filtered to the items, containing the entered phrase.

![](https://blobscdn.gitbook.com/v0/b/gitbook-28427.appspot.com/o/assets%2F-LD6FsRvQ3jgwJIg6O7r%2F-LEodIDzmGvm_1cq-Zi6%2F-LEoeXccZ3xQAjKGiqsf%2FlookupFiltered.png?alt=media\&token=8291908f-f0ba-44bf-b32a-7519e333e028)

Symbol lookup filtering

By the way, you can apply more general filtering to the list; just click the “***Filter***” icon on the right side of the search field and you will see the second level of symbols filtering.

![](https://blobscdn.gitbook.com/v0/b/gitbook-28427.appspot.com/o/assets%2F-LD6FsRvQ3jgwJIg6O7r%2F-LEodIDzmGvm_1cq-Zi6%2F-LEoerdCWFiOoQB9HD-i%2FlookupFilter2.png?alt=media\&token=5889941b-7dc0-4453-90fb-ec1b00acb89e)

General filtering of trading Symbols

Here you will be able to filter the list by three parameters:

* Connection (currently active connections)
* Symbol type (FOREX, CFD’s, Options etc.)
* Exchange (Off-Exchange, NYSE, NASDAQ etc.)

Once selecting some items among filtering parameters, the list becomes filtered to the selected values only.

Be careful. While the Searchfield is become reset each Lookup screen invoke, the second level filters stay as they were set up last time. So if you can’t find the required Symbol type — please check if you have this type enabled.

## Symbols list <a href="#symbols-list" id="symbols-list"></a>

The list of symbols is a result of filtering in Lookup screen. Here you can see the nested tree of Symbols, grouped in the following order:

* Connection
* Exchange
* Type
* Subtypes

The Symbol types are marked with additional icons to help you identify the required one more quickly. The Symbol item row consists of Name and description.

To select the Symbol — click on it; to apply the symbol to the required panel, just double-click on it. This action closes the Lookup screen

## Multiple symbols select <a href="#multiple-symbols-select" id="multiple-symbols-select"></a>

In some cases, when panel can accept more than one Symbol item from lookup (like the Watchlist), you have an ability to select multiple items by holding the "***Ctrl key***" and clicking on the list. Once you ready to apply multiple items — press the "***blue circle icon***" on the right bottom corner of the list. You may also select any category level item to apply all its contents to the required panel.

![](https://blobscdn.gitbook.com/v0/b/gitbook-28427.appspot.com/o/assets%2F-LD6FsRvQ3jgwJIg6O7r%2F-LEodIDzmGvm_1cq-Zi6%2F-LEogAPHWtBdFZFLHnge%2FlookupMultiple.png?alt=media\&token=9067c19b-eeb8-466d-a74f-806a189bcdfc)

Multiple Symbols select

To help you deal with the big lists of Symbols, there is a footer toolbar with a set of mass actions. It allows to:

* Collapse all nodes
* Expand head nodes (top-level nodes, usually Connections)
* Expand first-level child nodes

![](https://blobscdn.gitbook.com/v0/b/gitbook-28427.appspot.com/o/assets%2F-LD6FsRvQ3jgwJIg6O7r%2F-LZFsrT-K-_sZf_fFJEd%2F-LZFzQf2-tDHmZGRj9Vr%2Fcollapsing.gif?alt=media\&token=9a9daa8b-537f-4f64-bce8-8a1edebc71f1)

Managing of multiple nodes in the Lookup Screen

The other useful information is placed on the right side of footer toolbar — items count. It may show the total amount of available Symbols (after the filtering was applied) as well as 3/235 (3 from 235) value, saying that you have selected multiple items among available.


# Table management

Get to know how to add or remove columns in the table, sort and filter data, set alerts and actions

## Table panels <a href="#table-panels" id="table-panels"></a>

Table panels are represented as a separate class — they all have at least 99% of functionality based on the table view. We use the common table component for all of these panels, so the behavior and features are mostly the same.

![](https://blobscdn.gitbook.com/v0/b/gitbook-28427.appspot.com/o/assets%2F-LD6FsRvQ3jgwJIg6O7r%2F-LFqorWfAjWaGYwswV2L%2F-LFqoyoJuf9bhBxOV-d9%2FTablePanels.png?alt=media\&token=5dda7b18-9e5b-4293-84cd-f270ef22f97b)

Table panels example

Some table panels have a special toolbar that can be used for Mass-filtering or Quick actions. Other table panels can have no column headers because they don’t really need for understanding the data, thus were hidden to save space; this disables an ability to filter columns data in such panels.

## Columns management <a href="#columns-management" id="columns-management"></a>

Data in table panels are organized in rows and columns, where each item’s (row) parameters are displayed in columns. Not all of the available columns are displayed by default in each table panel. We have selected the most popular and vital per panel and made an ability to modify the columns set as you like.

![](https://blobscdn.gitbook.com/v0/b/gitbook-28427.appspot.com/o/assets%2F-LD6FsRvQ3jgwJIg6O7r%2F-LFqorWfAjWaGYwswV2L%2F-LFqpMIaZ6Yn9GKi4KqP%2FTableColumns.png?alt=media\&token=480832d6-1781-45e7-9761-b34c15199eb3)

Modify table columns set as you like

Right-click on any column header to see the “***Column set***” context menu. Then click on any item in this menu to switch the column’s visibility. You can disable up to 1 column minimum; the last visible column won’t be available to hide.

Other useful features of columns management are sorting and resize. Each column can be dragged by its header between other columns inside the table in order to set the required sequence. You can also drag the vertical borders between two columns to resize them.

## Filtering <a href="#filtering" id="filtering"></a>

The set of rows in the table can be filtered by some data value in their column. There are two ways to apply the filtering:

* Quick table filter
* Advanced table filter

Quick table filter is just another point of access to advanced filtering option, allowing to apply simple filters in several clicks.

Quick table filter can be accessed by clicking the “***Filter***” icon in any table column’s header.

![](https://blobscdn.gitbook.com/v0/b/gitbook-28427.appspot.com/o/assets%2F-LD6FsRvQ3jgwJIg6O7r%2F-LFqorWfAjWaGYwswV2L%2F-LFqqKfyxI-bnUFa7sGg%2FTableQuickFilter.png?alt=media\&token=994801a4-5dd5-4df4-805e-21c9cd458105)

Quick filtering per column

Depending on the data type in a column, the Quick filter will give you the corresponding form for input; currently “***String***”, “***Date/time***” & “***Number***” filtering are supported. Once you select some option — the table rows will be filtered to that ones, containing the selected value. Quick filter can be cancelled by pressing “***Cancel filtering***” option.

## Advanced table filter <a href="#advanced-table-filter" id="advanced-table-filter"></a>

In case you would like to apply some more complex filtering (multi-filtering) you can open an advanced filter from panel’s context menu, option “***Setup actions***”. This screen has two tabs on the left side, where the first one is an Advanced filter.

You will see your filters here if you have applied some previously in Quick mode.

![](https://blobscdn.gitbook.com/v0/b/gitbook-28427.appspot.com/o/assets%2F-LD6FsRvQ3jgwJIg6O7r%2F-LFqorWfAjWaGYwswV2L%2F-LFqqvJ1QgfZwbLwX8-P%2FTableAdvancedFiltering.png?alt=media\&token=15bb2602-9410-4a9b-8acf-7f594c01c2e2)

Table advanced filter screen

This screen allows you to Enable/disable filtering as well as set up filtering Conditions. These conditions are set up as:

IF(condition1ANDcondition2...)OR(conditionN...)…IF (condition1 AND condition2 ...) OR (conditionN...) …IF(condition1ANDcondition2...)OR(conditionN...)…

You can setup as many conditions as you like. Due to the possible complex logic of filtering, you are required to apply the changes once you finished the filter set up.

Please notice, not all of applied via Advanced filter conditions can be accessed from the Quick filter.

## Sorting <a href="#sorting" id="sorting"></a>

Each table can be sorted by column value. To sort the table, click on column’s header; you will see a “***Sorting***” icon appears. The next click on this header will revert the sorting by this column. You can sort your table only by one column simultaneously.

## Grouping <a href="#grouping" id="grouping"></a>

If you want to organize your rows more precisely, you can use a “***Rows grouping***” feature. It allows separating all table items in groups, made from data of some column. Currently, only “***String***” data columns are supported for grouping.

![](https://blobscdn.gitbook.com/v0/b/gitbook-28427.appspot.com/o/assets%2F-LD6FsRvQ3jgwJIg6O7r%2F-LFqorWfAjWaGYwswV2L%2F-LFqs-74I9M4cKwStDeH%2FTableGrouping.png?alt=media\&token=d98a4b7d-4689-4a90-ad85-d6b700079986)

Table grouped by “Side” value

To apply the grouping just right-click on table body and find an option “***Group by***”; the second-level of context menu will contain all of available columns that can be grouped by. You can group by one column only. To cancel grouping — follow the previous steps and uncheck the column.

## Table actions <a href="#table-actions" id="table-actions"></a>

This feature allows you to setup certain behavior on some data change in the table. Currently, 3rd Dimension tables support four types of actions:

* Show message
* Play sound
* Color row
* Color cell

![](https://blobscdn.gitbook.com/v0/b/gitbook-28427.appspot.com/o/assets%2F-LD6FsRvQ3jgwJIg6O7r%2F-LGPhAKcFnSgrFfJaMpz%2F-LGPhOY5ZRhwFjCRjV2s%2Ftableactions.png?alt=media\&token=40c3e8f2-9b53-47f3-a5df-149e8a1d9c8f)

Table actions per any 3rd Dimension table-based panel

The Table actions functionality can be found under the panel’s context menu option “Setup Actions” and once launched, it opens an “Actions screen”, where you can manage your Actions. The process of Action creation is not complicated.

1. Create an Action item
2. Set conditions (“OR” & “AND”)
3. Set tasks (Show message, Play sound, Color row, Color cell)
4. Save Action
5. Enable Action

## Table actions conditions <a href="#table-actions-conditions" id="table-actions-conditions"></a>

Conditions setup for Table Actions is similar to [Filtering conditions, mentioned earlier](/general-settings/table-management#advanced-table-filter).

## Table actions tasks <a href="#table-actions-tasks" id="table-actions-tasks"></a>

Once some condition is met, action will execute the corresponding tasks. Each task will be executed as many times, as the condition was met.

Be careful with the frequently occurring conditions. Some may be met several times per second, so tasks like “*Play sound*” can become disturbing. The “*Show message*” task, fired several times, will be shown as one message box.


# Alerts

Setting up alerts in 3rd Dimension

**Alert** on the financial market is a standard signal that notifies you when the price reaches a certain level on the chart, pre-set in the settings. A notification comes in the form of: sound, a notification opened on the monitor, a [telegram ](/miscellaneous-panels/3rd-dimension-telegram-bot)email sent instantly as soon as the price has approached a specific value.

<div><figure><img src="https://content.gitbook.com/content/urdqk4sHwHHpr4J3s5P6/blobs/0thEBLhhxaM9M6wr458P/alert%20list.png" alt=""><figcaption></figcaption></figure> <figure><img src="https://content.gitbook.com/content/urdqk4sHwHHpr4J3s5P6/blobs/upLBNYCNfaxtruijrUnI/3rd%20Alert.jpg" alt=""><figcaption></figcaption></figure></div>

**Alerts** are already available by default in any 3rd Dimension. You can choose sound files for the Alerts from the offered ones or set your own signal that you like as a soundtrack. All the other options for alerts in 3rd Dimension, relevant to the usual graphic shapes - color change, drag and drop, double click menu call, etc.

### How to set up 3rd Dimension Alerts on chart

In the **alert settings,** you can specify single or multiple triggers. To make sure you don't miss an Alert, I leave the multiple triggers. This can be annoying at times.&#x20;

<figure><img src="https://content.gitbook.com/content/urdqk4sHwHHpr4J3s5P6/blobs/SqCVLUGjNY5glahplnOd/setalert-ezgif.com-video-to-gif-converter.gif" alt=""><figcaption></figcaption></figure>

### Managing the alerts in 3rd Dimension&#x20;

Sometimes you will have a lot of alerts. Use the Object manager to manage them. A double-click on an Alert will move you to the point on the chart where that Alert is set.You can also edit it or delete unnecessary alerts.

{% hint style="danger" %}
**Important:** The alert will only work on an open chart. If you switch the chart on which you set the alert from one symbol to another alert will not work
{% endhint %}

### How to set up 3rd Dimension Alerts on watchlist

[Watchlist ](/analytics-panels/watchlist)panel shows brief pricing information on selected instruments, which you can group into lists. There are two ways to get to the settings menu.&#x20;

* From the menu of this window, select Setup Actions
* Right-click on the desired symbol and find Alert in the menu

<figure><img src="https://content.gitbook.com/content/urdqk4sHwHHpr4J3s5P6/blobs/YBedOxGLd59OxBmUrIFd/%D0%90%D0%BD%D0%B8%D0%BC%D0%B0%D1%86%D0%B8%D1%8F%20(3).gif" alt=""><figcaption></figcaption></figure>

And so let's look at how to set up an alert. To do this, we need to do a few actions. Activate the alert / Enable Action Give a name to the alert. Specify the symbol of interest. Add a condition. Select an action when the condition occurs

<figure><img src="https://content.gitbook.com/content/urdqk4sHwHHpr4J3s5P6/blobs/4VsgsDYmTc0A96YMUauB/%D0%90%D0%BD%D0%B8%D0%BC%D0%B0%D1%86%D0%B8%D1%8F%20(2).gif" alt=""><figcaption></figcaption></figure>

{% hint style="danger" %}
Do not forget to activate the Enable Action button.
{% endhint %}

### How to copy conditions of Alerts

<figure><img src="https://content.gitbook.com/content/urdqk4sHwHHpr4J3s5P6/blobs/zOUDPhXEebhvhjh6ukNa/How%20to%20copy%20conditions%20of%20Alerts.webp" alt=""><figcaption></figcaption></figure>

You can also copy the Alert state and change only some parameters, such as the symbol and its values

### 5 steps for working with alerts on a chart

{% hint style="danger" %}
**Important:** The alert will only work on an open chart. If you switch the chart on which you set the alert from one symbol to another alert will not work

To get around this limitation, we will make a 10-step pattern
{% endhint %}

1\) Create a Watchlist and add the necessary coins to it. In fact, It is recommend no more than 20 coins. Better yet, only the ones that we are going to trade today or in the near term.  Assign a color to this panel, Choose any of the available colors.

<figure><img src="https://content.gitbook.com/content/urdqk4sHwHHpr4J3s5P6/blobs/yovH3FAKeyLCL921KJfN/W1.png" alt=""><figcaption></figcaption></figure>

2\) We need to have a chart on which we spend analytics, levels and alerts. Let us call it an analytical diagram. For each of it will be its own set-up as desired. We need to associate the analysis chart with the Watchlist by color. In my case I chose yellow.&#x20;

3\) Create a simple chart and remove all the controls and charts from it as much as possible. Let's call it a signal chart.  Synchronize the objects on the signal and analysis chart. Manually set a coin or symbol from Watchlist on the Signal Chart.&#x20;

<figure><img src="https://content.gitbook.com/content/urdqk4sHwHHpr4J3s5P6/blobs/sHMNWAngQOtgcnmIFuPu/w2.png" alt=""><figcaption></figcaption></figure>

4\) Duplicate this signal chart as many times as there are symbols in Watchlist and set other coins on them. Create a group of tabs from the resulting Signal Graphs.&#x20;

<figure><img src="https://content.gitbook.com/content/urdqk4sHwHHpr4J3s5P6/blobs/cev0GSwQh1l9D91MLGAF/W3.png" alt=""><figcaption></figcaption></figure>

Go to the analytical chart and analyze and set levels and alerts. All alerts must be duplicated in our group of charts for a particular coin. We check that all levels are set on the signal chart.&#x20;

<figure><img src="https://content.gitbook.com/content/urdqk4sHwHHpr4J3s5P6/blobs/R0BKlRfglynmvb3KTKiN/ww2.png" alt=""><figcaption></figcaption></figure>

5\) Wait for the alert to trigger, evaluate the market action and earn profits

{% hint style="success" %}
So we have Watchlist for fast switching between charts. Analysis on our favorite chart and notification signals from our levels.
{% endhint %}


# General settings

General settings — is a screen, where you can set up the most common behavior of the whole 3rd Dimension platform.

Click on the **Gear icon** on the [main toolbar](/general-settings/3rd-dimension-main-toolbar) to open General Settings.

<figure><img src="https://content.gitbook.com/content/urdqk4sHwHHpr4J3s5P6/blobs/NzemiVIJiUn7KgrleSQn/general%20settings.png" alt=""><figcaption><p>General Settings are placed on the platform's main toolbar (Gear Icon)</p></figcaption></figure>

It is logically grouped into several tabs:&#x20;

* [**General**](#general-settings-tab)
* [**Control Center**](#control-center)
* [**Sounds**](#sounds)
* [**Confirmations & Warnings**](#confirmations)
* [**Time zone settings**](#time-zones)
* [**Excel RTD**](#excel-rtd)
* [**Messengers**](#messengers)
* [**Hotkeys**](#global-hotkeys)
* [**Trading protection**](#trading-protection)

{% hint style="info" %}
Most changes are applied automatically, but complex settings require confirmation for proper implementation.
{% endhint %}

## General settings tab

<figure><img src="https://content.gitbook.com/content/urdqk4sHwHHpr4J3s5P6/blobs/Opfw1gr6BRyVKpnVQcie/general%20settings1.png" alt=""><figcaption><p>General settings of 3rd Dimension— Localization, Themes, Sounds, RTD, Time zones</p></figcaption></figure>

**Theme** — Сhoose one of the 8 color schemes that suit you best

* Default Blue theme
* Dark Autumn
* Dark Forest
* Dark Gold
* Grayscale
* Light Forest
* Light Gold
* Light Water

<div data-full-width="true"><figure><img src="https://content.gitbook.com/content/urdqk4sHwHHpr4J3s5P6/blobs/ZNONtlUg0iK2VJr2iVTQ/themes-ezgif.com-video-to-gif-converter.gif" alt=""><figcaption><p>Coloring themes in 3rd Dimension</p></figcaption></figure></div>

**Language (beta)** — 3rd Dimension supports 17 languages. In case of errors or inaccuracies in translation, any user can make changes to the text. Read the manual on how to make changes in the selected language.

**Default symbol** — set up a default trading symbol that will open in all trading panels automatically.

**Default account** — specify the trading account that should be set as the default option in all trading panels.

**Data latency limit, ms** — set a threshold value, and when it's reached, a message about market data delays will be displayed in the trading panels. For example, if you set a 100 ms limit, you will see the message on the chart.

This message appears when there's a delay in data within a specific time interval. The cause may stem from a <mark style="color:red;">**slow Internet connection**</mark> or <mark style="color:red;">**issues on the data provider's end**</mark>.

Whether the data delay occurs on a Bybit server, Kucoin, OKX, Binance, or during transmission to the client, we make efforts to identify instances where server-side timestamps start to lag.

Additionally, you have the option to mitigate data load by closing panels, disabling volume tools, or closing unnecessary tabs in your browser (if it's active while using the platform).

<figure><img src="https://content.gitbook.com/content/urdqk4sHwHHpr4J3s5P6/blobs/HRu9RTvELjIwf9EUn73o/data%20latency.webp" alt=""><figcaption><p>Data latency on a chart panel</p></figcaption></figure>

**Autosave settings (every 5 minutes)** — 3rd Dimension will save all changes of application settings in the "Settings" folder and overwrite them every 5 minutes while the application is active. It also saves on application close.

**Abbreviate volume & ticks** — this option displays the volume values or the number of ticks in a simplified form (1K = 1 000; 10K = 10 000 etc.)

<figure><img src="https://content.gitbook.com/content/urdqk4sHwHHpr4J3s5P6/blobs/Hrv1Y8ugBB2d7899aENK/Abbreviative%20Volume%20&amp;%20Number%20of%20Ticks.webp" alt=""><figcaption><p>Abbreviative Volume &#x26; Number of Ticks</p></figcaption></figure>

**Abbreviate crypto prices** — this option displays the abbreviated values of cryptocurrency prices that have a large number of zeros.

<figure><img src="https://content.gitbook.com/content/urdqk4sHwHHpr4J3s5P6/blobs/Kn3ndPXTIhDElcMw4SF8/Abbreviate%20cryptos.gif" alt=""><figcaption></figcaption></figure>

**Unload inactive workspaces.** If this option is enabled, previously created workspaces will not receive market data updates, reducing memory usage.

<figure><img src="https://content.gitbook.com/content/urdqk4sHwHHpr4J3s5P6/blobs/rpcwFXHJNFupzlm688XT/work%202.png" alt=""><figcaption></figcaption></figure>

**Hide part of an account name.** Specify the number of characters that will be hidden for your trading account name and ID. This option is used to keep the account private.

<figure><img src="https://content.gitbook.com/content/urdqk4sHwHHpr4J3s5P6/blobs/bwRBDycA5fFSGVRPmT5e/hide%20account.webp" alt=""><figcaption></figcaption></figure>

[**Beta Version**](/getting-started/3rd-dimension-beta)**.** When this option is activated, you will receive updates to new functionality that is still in testing. We strive for our traders to use fully working functionality, but for this, we need the help of each user. Therefore, we ask as many people as possible to use the Beta version to inform us about possible bugs that eluded our testers.

## Control Center

Control center is the starting point of the platform and acts as both a launcher and informer. To optimize space, we've added the option to show/hide certain controls.

<figure><img src="https://content.gitbook.com/content/urdqk4sHwHHpr4J3s5P6/blobs/DkAnS0XM54TM0lmK2Hq8/control%20center.png" alt=""><figcaption><p>Configure the display of controls on the main control panel</p></figcaption></figure>

## Sounds

Sounds can be enabled or disabled for specific actions, providing additional interaction with users even when they're not in front of their PC.

<figure><img src="https://content.gitbook.com/content/urdqk4sHwHHpr4J3s5P6/blobs/nvSv1Y1IDvqnNTLkP5kZ/General%20settings%20_%20Sounds.gif" alt=""><figcaption></figcaption></figure>

**Enable sounds** — activates or disables all of the application sounds globally

The group of actions in 3rd Dimension, when the sound should be played consists of the most vital situations in application usage. This list is not final and can be extended or changed later. Each option has a set of controls:&#x20;

* enable/disable checkbox
* action name
* sound path (you can select your custom path to any **.wav** file)
* prelisten button (play/stop)

## Confirmations

<figure><img src="https://content.gitbook.com/content/urdqk4sHwHHpr4J3s5P6/blobs/PvkF022M1PcHIJ9Nv1nB/confimations.png" alt=""><figcaption><p>Confirmations and Warnings management</p></figcaption></figure>

<table data-header-hidden><thead><tr><th>Confirm order placement</th><th width="95.33333333333331">true</th><th>Ask before placing an order</th></tr></thead><tbody><tr><td><strong>Confirm order placement</strong></td><td>true</td><td>Ask before placing an order</td></tr><tr><td><strong>Confirm order cancellation</strong></td><td>true</td><td>Ask before canceling an order</td></tr><tr><td><strong>Confirm order/position modification</strong></td><td>true</td><td>Ask before an order or position modifications apply</td></tr><tr><td><strong>Confirm position reversing</strong></td><td>true</td><td>Ask before reversing the position</td></tr><tr><td><strong>Confirm application close</strong></td><td>true</td><td>Ask before closing the 3rd Dimension platform</td></tr><tr><td><strong>Confirm bind close</strong></td><td>true</td><td>Ask before closing binds</td></tr><tr><td><strong>Confirm group close</strong></td><td>true</td><td>Ask before closing groups</td></tr><tr><td><strong>Show deal tickets</strong></td><td>true</td><td>Show the pop-up screens with the trading notifications</td></tr><tr><td><strong>Confirm hotkeys action</strong></td><td>true</td><td>Ask before making any action with Hotkey</td></tr></tbody></table>

## Time zones

In case you are trading in various markets that are in different time zones, you will find it useful to switch the time indicator in [**Control center** ](/general-settings/3rd-dimension-main-toolbar)to one of your favorite market times.

In Time zone settings group you can select what time zones are your favorite and should be displayed in a pop-up screen when you click the **Time** in **Control center**. Once you select several items from this list, you will then be able to switch between them easily.

<figure><img src="https://content.gitbook.com/content/urdqk4sHwHHpr4J3s5P6/blobs/1XOJ6MCw7fhJRFZZzS2b/fav%20Time%20zones.webp" alt=""><figcaption><p>Favorite time zones management</p></figcaption></figure>

## Excel RTD

Start from version 1.35 3rd Dimension supports Real Time Data (RTD) for sending data and other market information to Microsoft Excel®. Read our guide about [how to enable and use RTD function with 3rd Dimension.](/miscellaneous-panels/excel-and-rtd-function)

<figure><img src="https://content.gitbook.com/content/urdqk4sHwHHpr4J3s5P6/blobs/6F3E56o1rynxQNTwOsin/image.png" alt=""><figcaption><p>RTD function in 3rd Dimension trading platform</p></figcaption></figure>

## Messengers

3rd Dimension Alert Bot will send a message to your Telegram account about all events that you set in the platform. For example, set a price alert on the chart, and when the price will reach this level, a notification to the messenger will be sent.

<figure><img src="https://content.gitbook.com/content/urdqk4sHwHHpr4J3s5P6/blobs/FcrmDTYJUwCc01wYnvno/alert-ezgif.com-video-to-gif-converter.gif" alt=""><figcaption></figcaption></figure>

To add a bot to the Telegram, open the platform's **General Settings -> Messengers -> Duplicate alerts to Telegram**.

Specify your personal chat ID, which you can find out by clicking on the **Get ID** button. A new Chat ID Echo bot will open and it will show ***"Your Telegram Chat ID is: xxxxxxx"***\
Enter your chat ID in the corresponding field and then connect to the 3rd Dimension Alert Bot.

<figure><img src="https://content.gitbook.com/content/urdqk4sHwHHpr4J3s5P6/blobs/0tt3KaU4OcFOKPhEWeVV/messenger.png" alt=""><figcaption></figcaption></figure>

## Global Hotkeys

<figure><img src="https://content.gitbook.com/content/urdqk4sHwHHpr4J3s5P6/blobs/Rd5FIX60FVBlpm5b0F3R/hotkeys.png" alt=""><figcaption></figcaption></figure>

## Trading protection

<figure><img src="https://content.gitbook.com/content/urdqk4sHwHHpr4J3s5P6/blobs/3rCN1UyFQGkg48Ktuz79/Trading%20protection.png" alt=""><figcaption></figcaption></figure>

<mark style="color:purple;">**Application inactivity lock.**</mark> This option will lock the platform after a set period of inactivity, preventing any actions until the established PIN code is entered. If you remove the set password in settings, the lock feature will not be activated.

<figure><img src="https://content.gitbook.com/content/urdqk4sHwHHpr4J3s5P6/blobs/mBimMgrKJ51jmNy10xCY/image.png" alt=""><figcaption></figcaption></figure>

<mark style="color:purple;">**Orders Limitation**</mark><mark style="color:purple;">.</mark> When enabled, this feature restricts the platform from placing more orders (limit and stop orders) than a specified number within a set time period. This setting can affect copy trading, especially when using multiple accounts.


# Custom hotkeys

Custom Hotkeys functionality exists alongside the usual hotkeys settings and allows you to bind terminal-wide or panel-specific actions to some keyboard combinations

## How to create a custom hotkey?

You can find Custom hotkeys functionality in the [Chart ](/analytics-panels/chart)& [Watchlist ](/analytics-panels/watchlist)panels (for now) settings and the [General settings](broken://pages/nnskPmOU6YGv94UH57Pj) of the terminal. It is a separate collapsible block at the beginning of the Hotkeys section.

<figure><img src="https://content.gitbook.com/content/urdqk4sHwHHpr4J3s5P6/blobs/Po9mqcDYfrQHUnIxNB9a/hotkeys.png" alt=""><figcaption><p>Custom hotkeys in Chart panel settings</p></figcaption></figure>

To add some custom hotkey, you need to click the **\[+]** button on the top right corner and select a required action from the drop list. Please note that you can use most actions multiple times with different parameters (change to symbol, set period, place order, etc.). At the same time, some - are unique actions (Open specific panel, open [template](broken://pages/hHyruV5sANrS8yEv3vw1)).

After selecting an action, you will see the new hotkey settings row added to the list with a notification about the need to configure it before activating. Here you can set the name, select the action target, and, if available, set up additional settings. Next in a row comes a Hotkey combination field and a button to remove the whole row. As an alternative to deletion, you can also quickly disable the hotkey using the leading toggler.

### Place a custom order.&#x20;

This action is available in the General settings screen hotkeys. It lets you pre-configure some order and then send it instantly by pressing a specified Hotkey when using the terminal.

<figure><img src="https://content.gitbook.com/content/urdqk4sHwHHpr4J3s5P6/blobs/aeRInMSoyxPKsmSKgm6l/hotkeys1.png" alt=""><figcaption><p>Hotkey for quick order placement configuration</p></figcaption></figure>

Once added, this action requires to be pre-configured first. By clicking the **\[Gear]** button, you will get an [Order Entry panel](broken://pages/-LEAsY9m3bNqzhIdr7hO) where you should specify the order details and then click the **\[Save]** button. Now assign some hotkey for this action, and you are ready to go.

{% hint style="info" %}
Please note that if you have turned off the order placement confirmation, the platform won't notify you when doing this using the hotkey also. You can enable notifications before order placement in the [Confirmation & Warnings](broken://pages/nnskPmOU6YGv94UH57Pj#confirmations) section of the General settings screen.
{% endhint %}

### Run strategy&#x20;

You can create a hotkey to start any available pre-configured strategy using the hotkey. Once you add this action in General settings hotkeys, you must patiently configure the strategy parameters first because it will be launched in the background when the corresponding hotkey triggers.

<figure><img src="https://content.gitbook.com/content/urdqk4sHwHHpr4J3s5P6/blobs/i8HemL7ULaPCCTwhF1ZS/run%20strategy.png" alt=""><figcaption><p>Parameters for Strategy launch custom hotkey</p></figcaption></figure>

As in any other case with strategies management, you can see the list of active ones in a Strategies manager panel. There you can understand whether your strategy launched correctly and is working as you expected.&#x20;

### Worth to know&#x20;

* Panel-specific hotkeys are available for all panels of the same type&#x20;
* Panel-specific hotkeys trigger for the focused panel only&#x20;
* Global custom hotkeys trigger no matter in what panel of the platform you are working in


# Connections

Here are the articles in this section:

<table data-card-size="large" data-view="cards"><thead><tr><th data-type="content-ref"></th></tr></thead><tbody><tr><td><a href="/connections/3rd-market-cap">3rd Market Cap</a></td></tr><tr><td><a href="/connections/connections-manager">Connections manager</a></td></tr><tr><td><a href="/connections/connection-to-binance">Connection to Binance</a></td></tr><tr><td><a href="/connections/connection-to-bybit">Connection to Bybit</a></td></tr><tr><td><a href="/connections/connection-to-okx">Connection to OKX</a></td></tr><tr><td></td></tr><tr><td><a href="/connections/connection-to-bitfnex">Connection to Bitfnex</a></td></tr><tr><td><a href="/connections/connection-to-kraken">Connection to Kraken</a></td></tr><tr><td><a href="/connections/connection-to-hitbtc">Connection to HitBTC</a></td></tr><tr><td><a href="/connections/connection-to-poloniex">Connection to Poloniex</a></td></tr><tr><td><a href="/connections/connection-to-bitmex">Connection to Bitmex</a></td></tr></tbody></table>


# 3rd Market Cap

### Overview:

Market cap integration provides market capitalization history charts for 3500+ coins and 120+ categories in addition to total market capitalization dominance charts.

Key features:

* Charts Live update.
* Over 5 months of history depth.
* Dynamic categories supported.

### Categories:

Digital currencies are grouped into categories based on several criteria and characteristics, and these categories fall into three types:

1. **Global categories** :Globally popular categories where cryptocurrencies are classified based on common characteristics such as “smart contract platform”,”stablecoins”,”decentralized finance(DeFi)”,...
2. **Total market cap categories:**
   * Total market cap :includes all cryptocurrencies
   * Total-2 :includes all cryptocurrencies excluding bitcoin.
   * Total-3: includes all cryptocurrencies excluding bitcoin and ethereum.
3. **Dynamic categories:** changes dynamically based on cryptocurrencies contribution to the total market capitalization such as:
   * Huge cap: cryptocurrencies whose contribution to the total market capitalization is more than 10%.
   * Large cap :cryptocurrencies whose contribution to the total market capitalization is between 1% and 10%.
   * Medium Cap: cryptocurrencies whose contribution to the total market capitalization is between 0.1% and 1%.
   * Min Cap: cryptocurrencies whose contribution to the total market capitalization is between 0.01% and 0.1%.
   * Micro Cap: cryptocurrencies whose contribution to the total market capitalization is between 0.001% and 0.01%.

### **Recommendations:**

For better user experience we recommend the following:

To show *all categories* type the word “category” in symbols search box:

![](https://lh6.googleusercontent.com/qyCTYWcqWrlZ22iichBGV41kyfZjbVfL0wQPqfd_ynyfzqVT6l86LWwc8AYVjm7vm3KESUyo9o4F9ljAmdwWvl9qimsEhtjjcoFbE2a42MB4MX-7O4lPvAMf7JtmiYPdd8o0V5jj)

To view *total market cap* categories type the word “total” in the symbol search box:

![](https://lh5.googleusercontent.com/MSB9ZHp6JBqNrwqbnopuZsLfaSy50CPra6ByWislKSIvsmDRRyOUI9ZSxAbS1TAEP0DCD8S-nSa1ZSt2RTBE7XdB5H0943zxIu556__CB1LvfXTwCn__vZkQThkN36dvs40U7vBe)

To view *dynamic categories* type the word “cap” in symbols search box:

![](https://lh6.googleusercontent.com/6XOcYTvv1-Le-ZA_vWov_Ro7pDqwUM82PgjTEwmMJSezOdLRLZjm0bH3M8p5G1ZzhQAniNSp-1wNyyX0vODpifzY5SgM3lLl0Zo4lNUldYJN-dbwIh92aVESWx8qkySbJttVVztV)

**To view&#x20;*****dominance charts*****&#x20;type the word “dominance” in symbols search box:**

![](https://lh3.googleusercontent.com/UQkQrMU3YfuQh9AnTmDHIobI8O4LDzyJlzcFu9FvWUsQub2Tpy93CztC6pz5vA8fv28CFon04-nXGJXYttq46yjiyUnd15D8aw-A3VRR4PHYjXMXuir4LdLfiPzzNNlSIQJhB1iP)

### Notes:

1. Sometimes when loading a chart some data may be missing,to fix this problem try reloading history(right click anywhere on the chart window and select “reload history(server)”.
2. History depth is limited for time periods less than 1 hour,to load more history depth select a time period equal or greater than 1 hour.
3. When selecting a category from symbols list ,you can view it’s childs categories/currencies from the category childs section in symbol info window:

![](https://lh5.googleusercontent.com/dY2ib0nwWMzegO85KPFfibe0QD9OdJLBCHt7jJCV3n2lULw-5oCLReIbe6LOopgiGdqCMpn1AFn8RvlKU8TvnmsDzLpz_N2nxJMpcplBFj17IMlbVIHw41BvTeI4V9SPrwMHXHv5)

* For categories with more than 100 childs , only the first 100 childs are displayed.


# Connections manager

Connections manager allows select from available integrations the ones you are trading with and connect to them using your accounts

Connections are integrations with third-party providers that supply various data: trading quotes, symbols history etc.

![Launch the Connections Manager to select necessary connection](https://2549702640-files.gitbook.io/~/files/v0/b/gitbook-legacy-files/o/assets%2F-LermsgEXLRaKzd0flYx%2F-Lj2CErFqYFhmN7Bz8yB%2F-Lj2CGxfdp9JdhH4yM2a%2FLaunch%20the%20Connections%20Manager%20to%20select%20necessary%20connection.PNG?alt=media\&token=c308a72e-355e-4465-8245-2500525b5c10)

Launch the Connections Manager to select necessary connection

Each integration is developed and tested by 3rd Dimension specialists and guarantees the stability and security of all transferred information.

{% embed url="<https://youtu.be/8U670v66h1k>" %}
How to use Connections manager
{% endembed %}

## General information <a href="#general-information" id="general-information"></a>

**Connections manager** — is a screen that allows you to select from available integrations the ones you are trading with and connect to them using your accounts. While connecting to any integration, Connections manager remembers your login credentials and will use them for further auto-connects (reconnects in case of errors). If you don’t want to store your login credentials in manager, just click the “Lock” icon in the login form.

![Connections manager screen with multiple accounts](https://content.gitbook.com/content/urdqk4sHwHHpr4J3s5P6/blobs/rMTvyBiCGJNmzlErF58B/multiple-accounts.gif)

Connections manager screen consists of two columns: connections list & connection info. Connection info column holds an information about the active connection or Login form, in case if the current connection is not active.

Each active connection is marked with green Status dot by the left hand from its name. The "***Star***" icon indicates that connection is favorite and displayed on Control center toolbar. This icon is also used to **add/remove** a connection **from favorites**.

Connection login form varies depending on integration requirements. Usually, it has Login & password fields and “***Connect***” button. This button initiates the authorization process. Some integrations have settings (a “***Gear***” icon on the right side of connection logo) and account creation button (a “***User with plus***” icon on the right side of “***Connect***” button). Account creation redirects you to the integration vendor website.

Once connected, info column will contain the data about ping and current connection status text. There is a “***Disconnect***” button also.

## Multi-connect <a href="#multi-connect" id="multi-connect"></a>

{% hint style="info" %}
3rd Dimension supports multiple connections simultaneously, but this function available for Premium License only
{% endhint %}


# Connection to Binance

This guide helps you in a few simple steps to configure the connection to Binance with the correct settings.

The rapid development of crypto technologies pushes on the adaptation of not only market participants but also devs of trading applications. 3rd dimension trading platform continues to expand its list of crypto connections and offers to an increasing number of traders the usage of cool charting and analytical functionality.

We are pleased to introduce the new crypto exchange — **Binance** — in the arsenal of our trading application's connections. It means that now you can trade in crypto-currencies, using a wider trading functionality list:

* **Flexible customization of trading workspaces** with an ability to create Binds of panels and save it as Templates.
* **Time & Sales** panel, allowing to filter the trades over a specified size.
* Placing orders via the powerful **DOM trader** panel.
* **Crypto-balances** panel for checking your wallets.
* **Crypto Order Entry** panel, for convenient opening of crypto orders.
* Various order types, chart types, drawings, and indicators.
* **History Player** panel, that allows conducting manual backtesting of your trading strategy without any risk. More details about it you can read in [our review article](http://thirddimension.exchange/index.php/blog), which reveals the main points of using this module.
* 24/7 market access just like the exchanges.

#### How to start trading on Binance exchange using 3rd dimension platform?

1. Open and fund a Binance account at [www.binance.com](http://www.binance.com/).
2. Download 3rd dimension platform and launch it. More detailed instruction [how to install 3rd dimension app](/getting-started/installation).
3. Generate an API key on Binance to create a trade connection with 3rd dimension. Use this API key to log into the platform.

You may watch a short video, demonstrating the basic principles of getting started with Binance in 3rd dimension application:

{% hint style="danger" %}
**Important:** Order execution happens on the exchange side. We are merely displaying the information that we receive from the exchange.
{% endhint %}


# Connection to Bybit

Bybit is a cryptocurrency derivatives exchange that provides trading on the most popular crypto-assets like Bitcoin and Ethereum and their perpetual futures.

In this guide, we will cover all the steps required to create a trading account on Bybit and connect to the 3rd Dimension platform.

·        [Open an account on Bybit to get personal API keys.](#open-an-account-on-bybit-to-get-personal-api-keys)

·        [Upgrading Bybit account to unified.](#upgrading-bybit-account-to-unified)

·        [Possible Errors with Bybit connection.](#possible-errors-with-bybit-connection)

Note, that in the platform, you can connect to the exchange in two modes:

Info Mode — free and quick way to view charts and other data for cryptocurrencies on the Bybit exchange without the need to enter keys

Trading Mode — for trading on the Bybit exchange in demo or real mode. API Keys are required. Below you will show how to get keys for trading.

<figure><img src="https://content.gitbook.com/content/urdqk4sHwHHpr4J3s5P6/blobs/4x8UeWemayIzrRPIHwcl/Bybit%201.gif" alt=""><figcaption></figcaption></figure>

## Open an account on Bybit to get personal API keys

{% hint style="info" %}

* For REAL Trading please create an account on Bybit.com <https://partner.bybit.com/b/62129>
* For DEMO Trading please create an account on Testnet.Bybit.com[ https://testnet.bybit.com/](https://testnet.bybit.com/)
  {% endhint %}

Go to the[ Bybit official website using this link](https://partner.bybit.com/b/62129) and go through the procedure for registering a new account on the exchange.

For email registration, please enter your email, preferred password and (!) referral code 62129 Swipe the verification page then enter the verification code sent to your email inbox.

<figure><img src="https://content.gitbook.com/content/urdqk4sHwHHpr4J3s5P6/blobs/5snpMUFAa02EgV9XPIQj/Bybit%202.png" alt=""><figcaption></figcaption></figure>

To create/manage your Bybit API keys, please click onto the top right on your username. Inside the dropdown menu, click on 'API'.

<figure><img src="https://content.gitbook.com/content/urdqk4sHwHHpr4J3s5P6/blobs/md8cWoX0JeSuOGAmbGj6/1.png" alt=""><figcaption></figcaption></figure>

Click on 'Create New Key' located on the right side of the 'API Management' page

<figure><img src="https://content.gitbook.com/content/urdqk4sHwHHpr4J3s5P6/blobs/Sjb6mrYmRPy44DcXPq57/2.png" alt=""><figcaption></figcaption></figure>

{% hint style="warning" %}
You need to configure two-factor authorization on Bybit. It is necessary for creating keys.
{% endhint %}

Select your API key type

<figure><img src="https://content.gitbook.com/content/urdqk4sHwHHpr4J3s5P6/blobs/dQD8area3zBqIr3Z9Sqp/3.png" alt=""><figcaption></figcaption></figure>

The following pop-out window will appear. Please configure your API key according to your trading needs.

<figure><img src="https://content.gitbook.com/content/urdqk4sHwHHpr4J3s5P6/blobs/cyT7EkUxD2YkIiz6rrb0/4.png" alt=""><figcaption></figcaption></figure>

After entering all the required information, a window will appear to inform us that the API successfully added.

<figure><img src="https://content.gitbook.com/content/urdqk4sHwHHpr4J3s5P6/blobs/fmxwEl0WqdCvM230QvbM/5.png" alt=""><figcaption></figcaption></figure>

## Upgrading Bybit account to unified:

upgrading your Bybit account to unified trading Helps to reduce problems with 3rd dimension bots, to upgrade your account to unified first make sure to close any opened positions, cancel any placed orders, and then follow the steps below:

1. Upgrade the main account to a unified account:

<figure><img src="https://content.gitbook.com/content/urdqk4sHwHHpr4J3s5P6/blobs/usWQoTMK9KhtXkgF0KaN/unified%201.png" alt=""><figcaption></figcaption></figure>

2. Upgrade your API to UTA Pro:

<figure><img src="https://content.gitbook.com/content/urdqk4sHwHHpr4J3s5P6/blobs/Afz8ZCckZDmXDg7uuxnQ/unified%202.png" alt=""><figcaption></figcaption></figure>

## Possible Errors with Bybit connection

·        **"Timestamp error"** means that your local time on PC is not the same as on Bybit servers and it should be synchronized.

<figure><img src="https://content.gitbook.com/content/urdqk4sHwHHpr4J3s5P6/blobs/IYCwFnQpVWXISJsVsa8Z/time.png" alt=""><figcaption></figcaption></figure>

**·**        To solve it, please, go to **Windows Settings > Time & Language >** and click on **Sync Now** butto&#x6E;**.**

<figure><img src="https://content.gitbook.com/content/urdqk4sHwHHpr4J3s5P6/blobs/R9ltorBTUhp8L58soq6J/image.png" alt=""><figcaption></figcaption></figure>

Or you can right-click on the clock in the corner of the screen, then choose adjust date and time, then Sync now

<figure><img src="https://content.gitbook.com/content/urdqk4sHwHHpr4J3s5P6/blobs/x2Sd3m0kxSnajfveHbfd/Time.gif" alt=""><figcaption></figcaption></figure>

• Refuse (bybit)- you don't have enough funds - fund your account

<figure><img src="https://content.gitbook.com/content/urdqk4sHwHHpr4J3s5P6/blobs/TH0bNKCktw2UD3AHZhqY/Screenshot_1.png" alt=""><figcaption></figcaption></figure>

• To fix TPA errors after reconnection, update Bybit connection settings as the following:

<figure><img src="https://content.gitbook.com/content/urdqk4sHwHHpr4J3s5P6/blobs/usPJVGogca5aVGDMODQK/tpa1.png" alt=""><figcaption></figcaption></figure>

* &#x20;If your Bybit connection is unstable(It keeps disconnecting and reconnecting), try changing the WebSocket server from the connection settings, this may help to reduce the issue :

<figure><img src="https://content.gitbook.com/content/urdqk4sHwHHpr4J3s5P6/blobs/1zICsPvAwxeaDv8PeUZ6/tpa%202.png" alt=""><figcaption></figcaption></figure>

* unified account margin mode adjustment \
  when trading futures using Third Dimension trading bots, it's recommended to adjust the account margin mode to "Isolated" for better risk management and to avoid unexpected behavior.

<figure><img src="https://content.gitbook.com/content/urdqk4sHwHHpr4J3s5P6/blobs/tLv6PXFMMbi3k7bnBOPz/Isolated.png" alt=""><figcaption></figcaption></figure>


# Connection to OKX

OKX is an innovative cryptocurrency exchange with advanced financial services, providing everything for wise trading and investment.

In this guide, we will cover all the steps required to create a trading account on OKX and connect to the 3rd Dimension platform.

1- [How to Create an account on OKX exchange](#how-to-create-an-account-on-okx-exchange)\
2- [How to Create an API ](#how-to-create-an-api)\
3- [How to connect to 3rd Dimension ](#how-to-connect-to-3rd-dimension)

## How to Create an account on OKX exchange

Go to the [OKX ](https://okx.com/join/10584641)homepage and click on the [**Sign up**](https://okx.com/join/10584641) button located at the top right corner .

<figure><img src="https://content.gitbook.com/content/urdqk4sHwHHpr4J3s5P6/blobs/hF8xS0MzeNy007YhgH1w/signup.png" alt=""><figcaption><p>OKX Home Page</p></figcaption></figure>

Enter your email address in the **Email** field and click on the **Sign up**.

<figure><img src="https://content.gitbook.com/content/urdqk4sHwHHpr4J3s5P6/blobs/3Y2Ew1EIvMb4sXUiCDkn/image.png" alt=""><figcaption></figcaption></figure>

* Check your email for the six-digit registration verification code that OKX sent you and enter it in the **Enter code** field within 10 .

<figure><img src="https://content.gitbook.com/content/urdqk4sHwHHpr4J3s5P6/blobs/pP3IKHScTMNLRNagpVyg/code1.png" alt=""><figcaption></figcaption></figure>

* Enter the password you want to use for your account in the **Password** field and click on the **Next** button.

<figure><img src="https://content.gitbook.com/content/urdqk4sHwHHpr4J3s5P6/blobs/6LAxBFdUyZDV93R6pvkY/okx%20pass.webp" alt=""><figcaption></figcaption></figure>

* You can now access your OKX account dashboard and choose to buy crypto with a card or deposit crypto from another platform or wallet.

<figure><img src="https://content.gitbook.com/content/urdqk4sHwHHpr4J3s5P6/blobs/jl2aiqTg4QHH5tAzHzdX/okx%20dep.webp" alt=""><figcaption></figcaption></figure>

That’s it! You have successfully created an account on OKX exchange.&#x20;

## How to Create an API

To generate an API key, please follow these steps:

1. Click **Manage** on the right of the project you wish to create an API key from.

<figure><img src="https://content.gitbook.com/content/urdqk4sHwHHpr4J3s5P6/blobs/sh2k4uLtom2KC0SUkxgl/image.png" alt=""><figcaption></figcaption></figure>

2. Click **Create API key**.

<figure><img src="https://content.gitbook.com/content/urdqk4sHwHHpr4J3s5P6/blobs/36FS6srmrSi0VQqWdMFd/image.png" alt=""><figcaption></figcaption></figure>

3. Enter your **API key name** and **passphrase** for your new API key. Click **Create** to generate your API key.

<figure><img src="https://content.gitbook.com/content/urdqk4sHwHHpr4J3s5P6/blobs/a7j3xEbTjTdHP4oExfwx/image.png" alt=""><figcaption></figcaption></figure>

{% hint style="warning" %}
The passphrase will be needed to access the APIs. If the passphrase is lost, you will be unable to access the API key. Please write down and remember your passphrase.
{% endhint %}

Congrats! You have created an API key.

<figure><img src="https://content.gitbook.com/content/urdqk4sHwHHpr4J3s5P6/blobs/6tAK7gJ12urMpzHPpop9/image.png" alt=""><figcaption></figcaption></figure>

## How to connect to 3rd Dimension&#x20;

Note, that in the platform, you can connect to the exchange in two modes:

Info Mode — free and quick way to view charts and other data for cryptocurrencies on the OKX exchange without the need to enter keys

<figure><img src="https://content.gitbook.com/content/urdqk4sHwHHpr4J3s5P6/blobs/oLi5n49gMWZwXgkKSl6t/20240126133154-ezgif.com-video-to-gif-converter.gif" alt=""><figcaption></figcaption></figure>

Trading Mode — for trading on the OKX exchange in demo or real mode. API Keys are required. Below you will show how to get keys for trading.

<figure><img src="https://content.gitbook.com/content/urdqk4sHwHHpr4J3s5P6/blobs/vD7HehRrzZUkGJkO1ut5/okx2.png" alt="" width="524"><figcaption></figcaption></figure>

1- In this section we put the API key that we create before.\
2- In this section we put the security key .\
3- In this section we put the passphrase that we created it when we created the API.\
4- click connect to connect the API .

<figure><img src="https://content.gitbook.com/content/urdqk4sHwHHpr4J3s5P6/blobs/xaSivfWe9PHrNc9tLqRe/okx%20connected.png" alt=""><figcaption></figcaption></figure>


# Connection to Bitfnex

This guide helps you in a few simple steps to configure the connection to Bitfnex with the correct settings.


# Connection to Kraken

This guide helps you in a few simple steps to configure the connection to Kraken with the correct settings.


# Connection to Bitmex

As we continue our struggle to adding exchange connections like CQG, the platform receives more and more useful and important features.

Today we present version 1.33, which is included:

* long-awaited **BitMEX** (only market data) with the possibility of demo trading via Trading Simulator panel
* a new panel for combining two different connections into one — **Symbol Mapping Manager**
* **Chart Alerts** functionality for notification of the price crossing of a specified level
* Adding **trading via Option Analytics** panel, as well as various fixes

### &#x20;<a href="#market-data-from-bitmex" id="market-data-from-bitmex"></a>

We know that many of our users are waiting for integration to BitMEX crypto exchange. Such popularity is explained by the fact that it is possible to trade derivatives for different currency crypto (futures).

That's why today we’ve made the first step towards full-fledged integration — we connected the market data from the BitMEX exchange. In the next step, we will add real trading.


# Connection to HitBTC

This guide helps you in a few simple steps to configure the connection to HitBTC with the correct settings.

## Added trading on HitBTC, default settings for drawings & indicators and more customizations

One of the important elements of our platform development is feedback from users. That's why we have entirely dedicated this update not only to bug fixes and optimizations but also took into account requests from our users.

### Added Trading on HitBTC <a href="#added-trading-on-hitbtc" id="added-trading-on-hitbtc"></a>

In the previous version, we made a [connection to the HitBTC crypto exchange](http://thirddimension.exchange/index.php/blog) as a market data provider. Today we are pleased to announce that we have added the ability to trade on HitBTC using the 3rd dimension platform. Just enter your trading account data — **API Key** & **Secret Key** — and trade cryptocurrencies on a modern trading platform.

![](https://content.gitbook.com/content/urdqk4sHwHHpr4J3s5P6/blobs/VcWZTGFK6c4N9NeITIUR/hitbtc-trading.gif)


# Connection to Poloniex

This guide helps you in a few simple steps to configure the connection to Poloniex with the correct settings.

Just after the official release of 3rd dimension trading application, we announce the first trading connection with Poloniex crypto-exchange. Now any trader can try the brand-new trading application using the live account on one of the most popular crypto-exchanges.

When we were thinking about the first connection for our trading application, we decided to start from emerging market, that is fastly growing and attracting a lot of new traders each day. That is why we came to market of digital assets (or Crypto-currency) and started from one of the most popular Exchanges on it - [Poloniex](https://poloniex.com/).

#### All needed is on-board

The first release of 3rd dimension trading application consists of a number of basic functionalities, suitable for Crypto-trading, like "Chart" with a huge set of drawings and indicators, "Order entry" (including limit orders), "Depth of market" and "Watchlist". Trader can also see and manage its opened orders and positions using functional "Positions" and "Orders" panels. Additionally, trader will like an informational panels "Symbol Info" & "Account Info" that gives the all available information about the account and trading instruments.

#### What else can 3rd dimension propose to Poloniex trader?

The answer is - convenient trading environment. We paid a lot of attention to making the interface of 3rd dimension as much flexible as possible, giving the trader various leverages for workspace modification. It is possible to set up, group, bind panels and organize them in different trading environments, so-called - Workspaces. Worth to mention, that each separate panel can be customized individually via the personal settings screens. Trader can also set up the default "Setting Layouts" per each panel scope.

Wow. Looking on all of these advantages it is hard to ignore the possibility to try the 3rd dimension trading application with Poloniex account. In addition, we should mention, that being in an early stage, 3rd dimension is absolutely free-to-use application so don't hesitate and go to [Download 3rd dimension right now](https://updates.thirddimension.exchange/3rd-Dimension/x64/3rd_Dimension.exe).

And don't forget to [share your thoughts and impressions with our team](http://thirddimension.exchange/index.php/contact-us/) via your preferred way. We, the 3rd dimension Team, are always ready to hear any trader and do the best we can, to make your trading as much profitable as possible.


# Analytics panels

<table data-card-size="large" data-view="cards" data-full-width="true"><thead><tr><th data-card-target data-type="content-ref"></th></tr></thead><tbody><tr><td><a href="/analytics-panels/chart">Chart</a></td></tr><tr><td><a href="/analytics-panels/watchlist">Watchlist</a></td></tr><tr><td><a href="/analytics-panels/time-and-sales">Time &amp; Sales</a></td></tr><tr><td><a href="/analytics-panels/price-statistic">Price Statistic</a></td></tr><tr><td><a href="/analytics-panels/dom-surface">DOM Surface</a></td></tr><tr><td><a href="/analytics-panels/option-analytics">Option Analytics</a></td></tr></tbody></table>


# Chart

Learn how to launch and configure the chart panel. What types of charts are available in the platform? How to activate volumetric analysis tools? Get to know about overlays, indicators and drawings.

The chart panel is one of the most important panel for an active trader. Accurate market data, graphical and analytical tools are integral components of the panel, which allow you to make the right trading decisions.

![Main parts of Chart panel in 3rd Dimension](https://content.gitbook.com/content/urdqk4sHwHHpr4J3s5P6/blobs/BVgN1AEKhNCexvS9Pv8m/Main%20parts%20of%20Chart%20panel%20in%20Quantower.png)

Main parts of Chart panel in 3rd Dimension

The chart panel can be divided into 5 parts:

* primary or [**top toolbar**](#top-toolbar) with the main controls
* **the chart area** itself with the displaying of price data, indicators, positions
* **​**[**sidebar menu**](#sidebar-menu-or-object-toolbar) with controls of indicators, drawings, overlays and object manager
* **chart order entry** with hot buttons for quick trading
* bottom toolbar with **volume analysis tools**

### Top toolbar

The top toolbar allows you to select a trading instrument, set the chart type and style, timeframe, depth of market data as well as call additional toolbars. Here is the list of [chart types and styles](/analytics-panels/chart/chart-types) where you can find a detailed explanation of how to build them.

![Primary or Top toolbar with the main controls](https://content.gitbook.com/content/urdqk4sHwHHpr4J3s5P6/blobs/zigieg6rPvWgbgp825KX/top%20toolbar.png)

### Sidebar menu or object toolbar

The sidebar menu allows you to add an indicator to the chart, a drawing tool or an overlay, and also manage all objects through the object manager.

![An overview of Sidebar menu with indicators, drawings and overlays](https://content.gitbook.com/content/urdqk4sHwHHpr4J3s5P6/blobs/inPWBXnEYf4msrXNmKwM/Chart%20Sidebar%20menu.png)

An overview of Sidebar menu with indicators, drawings and overlays

For traders who often refer to certain drawings, there is an option to fix them on the Sidebar. For this, near each drawing there is an "Star" icon, upon activation of which you add them to the Favorite List.


# Chart types

Select various chart types and styles that the most suite for your trading approach

Select various chart types and styles that the most suite for your trading approach

3rd Dimension offers a variety of chart types to help you display chart data in different formats. You can change chart type from ***Aggregation type*** menu as shown below.

![Switch between different time frames in one click](https://content.gitbook.com/content/urdqk4sHwHHpr4J3s5P6/blobs/imd1JBEzsRMODQ5XGjn7/chart%20time%20selector.png)

## Chart types and styles <a href="#chart-types-and-styles" id="chart-types-and-styles"></a>

3rd Dimension provides 8 chart types:

* [Tick chart](/analytics-panels/chart/chart-types/tick-chart)
* ​[Time chart](https://docs.thirddimension.exchange/analytics-panels/chart/chart-types/time-aggregation)​
* ​[Heiken-Ashi](https://docs.thirddimension.exchange/analytics-panels/chart/chart-types/heiken-ashi)​
* ​[Range Bars](https://docs.thirddimension.exchange/analytics-panels/chart/chart-types/range-bars)​
* ​[Renko](https://docs.thirddimension.exchange/analytics-panels/chart/chart-types/renko)​
* ​[Line Break](https://docs.thirddimension.exchange/analytics-panels/chart/chart-types/line-break)​
* ​[Kagi](https://docs.thirddimension.exchange/analytics-panels/chart/chart-types/kagi)​
* ​[Points & Figures](https://docs.thirddimension.exchange/analytics-panels/chart/chart-types/points-and-figures)​

![Chart types in 3rd Dimension](https://content.gitbook.com/content/urdqk4sHwHHpr4J3s5P6/blobs/aPVAVjgCHF43hmfqTy7N/chart%20types%20all.png)

Charts can also be represented in 5 different styles:

* Candle
* Bar
* Line
* Dotted Line
* Area

![Chart styles in 3rd Dimension](https://content.gitbook.com/content/urdqk4sHwHHpr4J3s5P6/blobs/ze7pAT61xA9TOBNfujJj/chart%20styles.png)


# Tick chart

How to set up tick chart.

Tick ​​Chart builds a new bar after a set number of trades, for example after every 610 trades. Basic charts (like time-based) draw a new bar after a set period of time, for example after every 5 minutes or hours.

For example, each bar of a 610 tick chart represents 610 trades of any size. A tick can be a trade of just one contract, or 10,000 contracts. This is why it’s crucial to combine the use of tick charts with volume.

![](https://content.gitbook.com/content/urdqk4sHwHHpr4J3s5P6/blobs/mJGLOBggIuyEYl2Z0jvj/image.png)

To set this chart type, open TimeFrame Selector and select in the drop-down menu — **Tick**.

![](https://content.gitbook.com/content/urdqk4sHwHHpr4J3s5P6/blobs/QZYRvFl1IJeRLBS7rsso/tick%20chart.gif)


# Time aggregation


# Renko

## General info <a href="#general-info" id="general-info"></a>

Renko chart is completely time-independent, based on price movement only and help filter out the noise that can occur on other chart types. Renko is built from bricks, which are created only when the price exceeds the body of the previous brick by a certain size, which is set by the trader in the chart parameters.

![General view of Renko chart type in 3rd Dimension](https://content.gitbook.com/content/urdqk4sHwHHpr4J3s5P6/blobs/wwMAObG8MUERgWUSE3LX/Renko%20chart%20general%20view.png)

## Renko chart calculation <a href="#renko-chart-calculation" id="renko-chart-calculation"></a>

The construction of the Renko chart is based on bricks, the size of which is set up by the trader. Thanks to this, the Renko chart ignores the time and focuses on price changes only. For example, by setting Brick size 10 points, the new brick will be built when the price is reaching out 10 or more points. Otherwise, the price of the Renko chart will not change.

* If there is an up brick before and the price will go up another 10 pips, a new up brick is be created
* If there is a down brick before and the price will go down another 10 pips, a new down brick is created
* If there is an up brick before, price needs to go down 20 pips, to create a new down brick
* If there is a down brick before, price needs to go up 20 pips, to create a new up brick

![Renko chart ignores time factor](https://content.gitbook.com/content/urdqk4sHwHHpr4J3s5P6/blobs/cG7B6EwCb9Mz0jU6LbIb/Renko%20chart%20vs%20regular%20chart.png)

## Calculation styles (methods) <a href="#calculation-styles-methods" id="calculation-styles-methods"></a>

In the Renko chart settings, you can choose one of several styles based on which the chart will be drawn:

* **Classic** — using closing price (or last price) only

![Settings for Renko Classic
](https://content.gitbook.com/content/urdqk4sHwHHpr4J3s5P6/blobs/88j99rFpz7rQzVNtXpYY/Renko%20classic%20settings.png)

![The size of each brick equal 100 poins](https://content.gitbook.com/content/urdqk4sHwHHpr4J3s5P6/blobs/n7DjsNfet5dmmmDt1Auy/Renko%20classic%20view.png)

**High / Low** — using high and low prices. If the previous brick was growing, then the current brick takes into account high prices first, and then low prices. If the price drops, the method takes into account the low prices first, and then high prices.

* **Advanced Classic (Advanced High / Low)** — this method allows you to build non-standard Renko charts based on the closing price (or high / low prices). To do this, use additional chart settings —

  *extension* (%) and *inversion* (%).
* **Show wicks** — allows you to add wicks to Renko bricks, indicating actual highs and lows within a brick.
* **Build current bar** — is the option that shows/visualize the creation of the current brick in real-time. If you choose one minute for your time aggregation, all Renko bricks, that would have been created based on price movement, will be plotted at once after one minute.

## Non-standard Renko charts <a href="#non-standard-renko-charts" id="non-standard-renko-charts"></a>

**Medium Renko** smoothes out the chart more than Classic Renko because an open price is in the middle of a brick. They will show fewer pullbacks and trend reversals are easier to spot. An *extension and inversion value of 50%* would create Median Renko bricks.

![Medium Renko chart construction](https://content.gitbook.com/content/urdqk4sHwHHpr4J3s5P6/blobs/Az3XxvDbtmDW75Lm37fF/median-renko_construction.png)

![Medium Renko in 3rd Dimension](https://content.gitbook.com/content/urdqk4sHwHHpr4J3s5P6/blobs/ON1BvCwFcbpe6WHXn3QQ/median-renko_quantower.png)

**Geometric Renko** will give you very smooth reversals, and the charts are smooth out more than with Median Renko. One special property of these Renko form is, that when using an *extension and inversion percentage of 12.5%*, the slope of up-bricks will be 45° and for down bricks -45°

![Geometric Renko chart construction](https://content.gitbook.com/content/urdqk4sHwHHpr4J3s5P6/blobs/WLviNaBcp4A31OoS7JNK/geometric-renko_construction.png)

![Geometric Renko chart construction](https://content.gitbook.com/content/urdqk4sHwHHpr4J3s5P6/blobs/AnZOS42bzwnMJMEi0tik/median-renko_quantower.png)

**Turbo Renko** smooths out the majority of pullbacks and only shows high probability reversals. Turbo Renko is using the *extension 12%* of the brick and the *inversion of 100%.* Price has to reverse by a complete brick to form a reversal, illustrated as the dashed bricks.

![Turbo Renko chart construction](https://content.gitbook.com/content/urdqk4sHwHHpr4J3s5P6/blobs/AkqsYK5gUGLeac1L9zBc/turbo-renko_construction.png)

![Turbo Renko in 3rd Dimension](https://content.gitbook.com/content/urdqk4sHwHHpr4J3s5P6/blobs/IHHh1zPEwAEYSvHgKXW5/turbo-renko_quantower.png)


# Heiken Ashi

## General info <a href="#general-info" id="general-info"></a>

Heiken-Ashi chart (HA) is a modified type of classic candlestick chart, which is based on recalculation of OHLC data. The resulting candlestick filters out some noise in an effort to better capture the trend and reversal points.

![General view of Heiken-Ashi chart type](https://content.gitbook.com/content/urdqk4sHwHHpr4J3s5P6/blobs/iUxjbdpGRY3wFQgZaOow/Heiken-Ashi%20chart.png)

The following calculations are used to construct the HA chart:

* HA Close = (O+H+L+C)/4
* HA Open = (HA Open (previous bar) + HA Close(previous bar))/2
* HA High = Maximum (H, HA Open, HA Close)
* HA Low = Minimum (L, HA Open, HA Close)

## Creation a new Heiken-Ashi chart <a href="#creation-a-new-heiken-ashi-chart" id="creation-a-new-heiken-ashi-chart"></a>

To open a new HA chart, you need to select Heiken-Ashi from the drop-down list of aggregations and specify the build parameters - ***Value*** and ***Build from***. Click **\[ Apply ]** and the chart will be built. If the number of candles (data) is not enough, then choose a greater depth of history, for example 1 year or 5 years.

You can create several predefined settings to quickly build HA charts. To do this, you need to configure the parameters and ***Add to favorites*** by pressing the Star icon.

![The creation process of Heiken-Ashi chart type](https://content.gitbook.com/content/urdqk4sHwHHpr4J3s5P6/blobs/vQwO4I7DyIAebsLTFMxc/Heiken%20Ashi%20creation.gif)

{% hint style="info" %}
Heiken-Ashi is used only with the Candle chart style.
{% endhint %}


# Kagi

## General info <a href="#general-info" id="general-info"></a>

As P & F chart and Range bars, **Kagi chart** is full time-independent and based on price action only. Kagi chart consist of vertical lines that connected by horizontal lines.

![Kagi chart in 3rd Dimension platform](https://content.gitbook.com/content/urdqk4sHwHHpr4J3s5P6/blobs/XJYzHYCvVsgjrfshjeNu/kagi-charts.png)

## Kagi chart calculation <a href="#kagi-chart-calculation" id="kagi-chart-calculation"></a>

There are two main parameters that affects on Kagi chart:

* **Built from and its value** — it's a parameter on the basis of which the chart will be print. If you set the 5 minute so the closing prices are taken from the 5-minute close.
* **Reversal** — the amount of price movement that required for the Kagi line to reverse direction. For instance, if you'll set 10 ticks for the reversal parameter it means that price need to change at least 10 ticks to print reversal line.

![Parameters for Kagi chart](https://content.gitbook.com/content/urdqk4sHwHHpr4J3s5P6/blobs/JmztazCiekiBoz7LwiPN/Kagi%20settings.png)


# Points & Figures

## General info <a href="#general-info" id="general-info"></a>

Points & Figures is one of the most popular chart types that allows traders to analyze only the price without time-bound, thereby eliminating market noise. In contrast to the usual candlestick charts, P & F consists of X and O columns, which reflect the rise or fall in prices, respectively.

![General view of Points & Figures chart type](https://content.gitbook.com/content/urdqk4sHwHHpr4J3s5P6/blobs/R64Siau9ki3c42Opg9x8/Point%20&%20Figure%20chart%20type.png)

P\&F charts provide a unique look at price action that has several advantages:

* Filter insignificant price movements and noise
* Focus on important price movements
* Determine support and resistance levels
* Identify trends and reversal points
* Remove the time aspect from the analysis process

## How is the Point & Figure chart built? <a href="#how-is-the-point-and-figure-chart-built" id="how-is-the-point-and-figure-chart-built"></a>

![Main parameters for plotting P & F chart](https://content.gitbook.com/content/urdqk4sHwHHpr4J3s5P6/blobs/GSSU1YDcrFOcKGAujqSB/Point%20&%20Figure%20chart%20parameters.png)

The plotting of P & F chart depends on several basic parameters:

* **Box size**, which determines the price range (the number of ticks) for X-Columns or O-Columns. Each X and O occupies an area called ***Box***, the size of which is determined by the Box Size parameter. No Xs or Os are displayed if prices rise or fall by an amount that is less than the box size.
* **Reversal**, a parameter that indicates the number of Box Sizes that the price should go in the opposite direction to begin a new column. A new column, therefore, signals a change in the price trend.
* **Build from** parameter specifies the time frame of the data that is used to build the Point and Figure bars.

To build a chart, you can use two styles:

* **Classic**, which uses only the closing price (last price) to plot the chart.
* **High / Low** is based on High and Low prices.

The difference between these calculation styles you can see on the screenshots below.

![P & F chart based on close prices (Classic style)](https://content.gitbook.com/content/urdqk4sHwHHpr4J3s5P6/blobs/99OoJn6C2vjETsXSyX13/Point%20&%20Figure%20classic%20style.png)

![P & F chart based on high or low prices (High/Low style)](https://content.gitbook.com/content/urdqk4sHwHHpr4J3s5P6/blobs/rxd5lD5BBd5cJ9iGjaFq/Point%20&%20Figure%20high_low%20style.png)


# Range bars

## General info <a href="#general-info" id="general-info"></a>

**Range Bars** chart consists of bars (candles) within a certain range, which is determined by the trader in the chart settings. Range Bars does not depend on time, but only on price movement. Thus, if the price has low volatility and stays in a range that is less than specified in the parameters, then new bars (candles) will not be built. Hence, the higher volatility of the trading instrument the more bars will be built; conversely, during periods of lower volatility, fewer bars will be built.

![Range bars in 3rd Dimension platform](https://content.gitbook.com/content/urdqk4sHwHHpr4J3s5P6/blobs/CIFybP0bPc1QpvhaTYpc/Range%20bars%20view.png)

## Calculation of Range Bars <a href="#calculation-of-range-bars" id="calculation-of-range-bars"></a>

To built range bars there are three simple rules:

* Each range bar must have a high/low range that equals the specified range.
* Every new range bar must open outside the high/low range of the previous bar.
* Each range bar must close at either its high or its low.


# Line break

## General info <a href="#general-info" id="general-info"></a>

**Line Break** is quite similar to other time-independent charts like Kagi, P & F, Range Bars. Line break chart prints the series of bars which represent increasing and falling prices. The key parameter that participates in the chart plotting is the number of the last bars for building the current bar.

![General view of Line Break chart in 3rd Dimension](https://content.gitbook.com/content/urdqk4sHwHHpr4J3s5P6/blobs/zo9w0tDr2FvdFO0xt3dG/Line%20break%20chart%20general%20view.png)

It is important to note that the bars on this chart are usually called "lines". Line Break based on closing prices so it takes the current price and compares it with the closing prices of the previous bars (lines). The number of the previous bars that participate in the calculation specified in the chart settings.

## Line Break calculation <a href="#line-break-calculation" id="line-break-calculation"></a>

The most common number of Line Break setting is 3. It means that the closing price of the current line is compared to the closing price of the third line ago.

![Chart settings for Line Break](https://content.gitbook.com/content/urdqk4sHwHHpr4J3s5P6/blobs/5iGKhWuZSSHzuz6beGkU/Line%20break%20settings.png)

Each new closing price has three possible outcomes:

* a new line with the same color — build when the price goes in the same direction.
* a new line with the opposite color — build when the price change is enough to warrant a reversal.
* no new lines are added when the price does not extend the trend or the change is not enough to warrant a reversal.

![An example of how to build a Line Break chart](https://content.gitbook.com/content/urdqk4sHwHHpr4J3s5P6/blobs/3epLborcd7JgWWTjA0P6/Line%20break%20example.png)

In the example above shows areas where the line color was changed. The yellow line shows the level of the third bar, when it breaks, the line color changes.


# Chart overlays

{% embed url="<https://youtu.be/QKXaX_xEIjA>" %}
Chart Overlay. How to add multiple instruments on a single chart.
{% endembed %}


# Technical indicators

Get to know how to add technical indicators to chart and manage them in one click.

{% embed url="<https://youtu.be/-2SeRT4F4co>" %}

{% content-ref url="/pages/NFLnQRsmEi4wXJkWmqVY" %}
[Oscillators](/analytics-panels/chart/technical-indicators/oscillators)
{% endcontent-ref %}

{% content-ref url="/pages/K0s3TA4xIqxF1hbEaSrH" %}
[Moving averages](/analytics-panels/chart/technical-indicators/moving-averages)
{% endcontent-ref %}

{% content-ref url="/pages/XB3yzdH10pbEiwVTh8SL" %}
[Volatility](/analytics-panels/chart/technical-indicators/volatility)
{% endcontent-ref %}

{% content-ref url="/pages/9y97rfTwMPAPLPlcU3HJ" %}
[Trend](/analytics-panels/chart/technical-indicators/trend)
{% endcontent-ref %}


# Diversified Divergence (DivDiv)

Indicator

### What is Divergence?

Divergence is when the price of an asset is moving in the opposite direction of a technical indicator, such as an oscillator.

And it warns that the current price trend may be weakening, and could lead to change in the price direction.

![](https://content.gitbook.com/content/urdqk4sHwHHpr4J3s5P6/blobs/bOWOCPcbKr6VW70A5QA5/image.png)

**What are the best indicators to use for divergence?**

In general all oscillator indicators can be used in spotting divergence. We added the most famous indicators that traders use to spot divergence such as [RSI](/analytics-panels/chart/technical-indicators/oscillators/relative-strength-index-rsi-indicator), Stochastic, [MACD](/analytics-panels/chart/technical-indicators/oscillators/moving-average-convergence-divergence-macd), [Momentum](/analytics-panels/chart/technical-indicators/oscillators/momentum), [CCI](/analytics-panels/chart/technical-indicators/oscillators/commodity-channel-index-cci).&#x20;

### How to use Divergence?

Traders use divergence to assess the likelihood of a price reversal for a certain asset. If the asset price is rising and making new highs, ideally the oscillator is reaching new highs as well. If the asset price is making new highs, but the oscillator starts making lower highs, this warns the price uptrend is weakening and a reversal or pullback is possible. On the other hand, if the asset price is creating lower lows and the oscillator is forming higher lows that indicate the down trend is weakening and reversal can happen.

**What is unique about Divergence?**

Divergence is considered as a leading indicator even though it uses lagging indicators. What makes divergence a unique signal is that it is not obvious to the naked eye which makes it more valuable to the trader because less people will be able to spot such a signal in the market.

Divergences can help us find better and more reliable trade entries. Divergences can not only be used by reversal traders but also trend-following traders can use divergences to time their exits.

**Types of Divergence:**

![](https://content.gitbook.com/content/urdqk4sHwHHpr4J3s5P6/blobs/eL3woneVOlM0qzkCnVOC/image%20\(1\).png)

Divergence signals can be categorized based on its direction or its effect direction, and then on its strength.

**Regular Divergence (indicate reversals)**

&#x20;Bullish Divergence: Price creates lower low and the indicator creates higher low

&#x20;Bearish Divergence: Price creates higher high and the indicator creates lower high

**Hidden Divergence (indicate continuation)**

&#x20;Bullish Hidden Divergence: Price creates higher low and the indicator creates lower low

&#x20;Bearish Hidden Divergence: Price creates lower high and the indicator creates higher high

**Divergence Classes (strength)**

&#x20;Class A (Strong): both price and indicator divergence lines are steep.

&#x20;Class B (Medium): Price line is almost straight while indicator line is steep.

Class C (Weak): Indicator line is almost straight while price line is steep.

**How to open DivDiv Indicator ?**

![](https://content.gitbook.com/content/urdqk4sHwHHpr4J3s5P6/blobs/CMFoTPyFqpBRQXF9CpDM/image%20\(2\).png)

Open DivDiv indicator from the indicators list on the upper left side of the chart panel.

To open the indicator settings just click on the name of the indicator in the sub-window.

### &#x20;**DivDiv Indicator settings**&#x20;

![](https://content.gitbook.com/content/urdqk4sHwHHpr4J3s5P6/blobs/fF4ZMqa2UkI6BA3scWTe/image%20\(2\).png)

**To change or edit the indicator’s settings tap on the oscillator as shown in the image above.**

![](https://content.gitbook.com/content/urdqk4sHwHHpr4J3s5P6/blobs/F4B6GxUmbO323zaqHMgC/image%20\(3\).png)

You will find five sections in Divergence settings. In order:

**1-  Divergence indicator settings**

**2- View**

**3- Oscillator settings**

**4- The oscillator line data series**

**5- Visible on specific time frame**

**And at last, the save settings icon.**

\
The majority of traders will only need to open the first section of the indicator settings to adjust Divergence. That is why you will find a guide to the first section in this manual.<br>

### **1-  Divergence indicator settings**

![](https://content.gitbook.com/content/urdqk4sHwHHpr4J3s5P6/blobs/o9R4jjmCf7K6RlXdhCoG/image.png)

**Indicator Base:** choose the Oscillator that you want to see the Divergence on it from the list of supported indicators. For example, we will choose RSI Relative Strength Index.

![](https://content.gitbook.com/content/urdqk4sHwHHpr4J3s5P6/blobs/9gAsSykZNwoyj7Yy7aPw/image%20\(1\).png)

**Divergence Type:** choose between two types of Divergence; the Regular (Reversal) type and the Hidden (Continuation) type.

![](https://content.gitbook.com/content/urdqk4sHwHHpr4J3s5P6/blobs/tteIiqSZmxm3Z8xjBZu5/image%20\(2\).png)

**Confirmation Method:**

It is the method to confirm the sign. When Divergence indicator sends signs whether they are reversal or continuous; then this points to how high or low which confirms the signal. You can change the confirmation method as shown in the following exampl&#x65;**.**&#x20;

(None) to see all possible Divergences without any type of confirmation,

(Last Peak) to see only the Divergences that the indicator closes above/below latest peak.

(Max Peak) to see only the Divergences that the indicator closes above/below maximum peak.

**Divergence Strength: (**&#x65;xplained in the Types of Divergence table above **)**

(Weak) DivDiv Indicator will show all strength levels of Divergence.

(Medium) DivDiv will show all medium and strong levels of Divergence.

(Strong) DivDiv will Show only strong levels of Divergence.

So if you select all, this is similar to “weak” because it means showing all signal levels.

The following figure shows an example in which the medium level was chosen.

![](https://content.gitbook.com/content/urdqk4sHwHHpr4J3s5P6/blobs/O72zj33rSQW0vCZVr2sv/image%20\(4\).png)

**Note the change in the number and type of signals when choosing “strong”**&#x20;

![](https://content.gitbook.com/content/urdqk4sHwHHpr4J3s5P6/blobs/Jb5AVUEjA6IBYoFehziO/image%20\(5\).png)

To scan divergences automatically check [DivScanner](broken://pages/VflYltx9NcBg0oOnuuBQ).


# Oscillators

{% content-ref url="/pages/T63Br4bwuHWfNvKiGXW8" %}
[Aroon Indicator](/analytics-panels/chart/technical-indicators/oscillators/aroon-indicator)
{% endcontent-ref %}

{% content-ref url="/pages/s3sbPAfm56K2OAhKfq4i" %}
[Moving Average Convergence/Divergence (MACD)](/analytics-panels/chart/technical-indicators/oscillators/moving-average-convergence-divergence-macd)
{% endcontent-ref %}

{% content-ref url="/pages/pEPpg3JhhpWbJ4Thk8Yc" %}
[Awesome Oscillator](/analytics-panels/chart/technical-indicators/oscillators/awesome-oscillator)
{% endcontent-ref %}

{% content-ref url="/pages/jYQBLfgHodFtGXmxYytk" %}
[Accelerator Oscillator](/analytics-panels/chart/technical-indicators/oscillators/accelerator-oscillator)
{% endcontent-ref %}

{% content-ref url="/pages/JTfeMLnfu7vRjhUbltq5" %}
[%R Larry Williams](/analytics-panels/chart/technical-indicators/oscillators/r-larry-williams)
{% endcontent-ref %}

{% content-ref url="/pages/SRDasg33aQEjDPgjN64o" %}
[Momentum](/analytics-panels/chart/technical-indicators/oscillators/momentum)
{% endcontent-ref %}

{% content-ref url="/pages/fcSX4okhoaDnqnWE4NYu" %}
[Rate of Change](/analytics-panels/chart/technical-indicators/oscillators/rate-of-change)
{% endcontent-ref %}

{% content-ref url="/pages/WyNkDfKgcr9OrCEgSxEB" %}
[Relative Strength Index (RSI) Indicator](/analytics-panels/chart/technical-indicators/oscillators/relative-strength-index-rsi-indicator)
{% endcontent-ref %}

{% content-ref url="/pages/5c3BTbaSJ6c1At7PUOwN" %}
[Commodity Channel Index (CCI)](/analytics-panels/chart/technical-indicators/oscillators/commodity-channel-index-cci)
{% endcontent-ref %}


# Aroon Indicator

## What is Aroon Indicator? <a href="#what-is-aroon-indicator" id="what-is-aroon-indicator"></a>

The Aroon indicator, developed by Tushar Chande, indicates if a price is trending or is in a trading range. It can also reveal the beginning of a new trend, its strength and can help anticipate changes from trading ranges to trends. AroonDown and the AroonUp indicators are used together and combined are called the Aroon indicator.**AroonUp** measures how long it has been since prices have recorded a **new high** within the specified period. If the current bar’s high is the highest within the user defined number of periods before it, then the AroonUp value is 100. In other words, it is a new high for the period. Otherwise it returns a percent value indicating the time since a new high occurred for the specified period.**AroonDown** measures how long it has been since prices have recorded a **new low** within the specified period. If the current bar’s low is the lowest within the user defined number of periods before it, then the AroonDown value is 100. In other words, it is a new low for that period. Otherwise it returns a percent value indicating the time since the new low occurred for the specified period.

## How Aroon indicator works? <a href="#how-aroon-indicator-works" id="how-aroon-indicator-works"></a>

* If the Aroon-Up crosses above the Aroon-Down, then a new uptrend may start soon. Conversely, if Aroon-Down crosses above the Aroon-Up, then a new downtrend may start soon.

![Aroon Indicator](https://content.gitbook.com/content/urdqk4sHwHHpr4J3s5P6/blobs/NfEwOpeTBX4qjlxF9Sdi/Aroon%20indicator.png)

When Aroon-Up reaches 100, a new uptrend may have begun. If it remains persistently between 70 and 100, and the Aroon-Down remains between 0 and 30, then a new uptrend is underway.

* When Aroon-Up and Aroon-Down move in parallel (horizontal, sloping up or down) with each other at roughly the same level, then price is range trading or consolidating.

## How is Aroon indicator calculated? <a href="#how-is-aroon-indicator-calculated" id="how-is-aroon-indicator-calculated"></a>

Aroon-Up = \[(Period Specified – Periods Since the Highest High within Period Specified) / Period Specified] x 100 Aroon-Down = \[(Period Specified – Periods Since the Lowest Low for Period Specified) / Period Specified] x 100


# Moving Average Convergence/Divergence (MACD)

## Description <a href="#description" id="description"></a>

Moving average convergence/divergence(MACD) indicator graphically describes the mathematical difference between fast and slow exponential moving averages. The third line is called a “signal line”. Common periods of moving averages are: 26 for a slow EMA, 12 for a fast and 9 for a signal line.

![](https://content.gitbook.com/content/urdqk4sHwHHpr4J3s5P6/blobs/l2257LxDIRjVKDYPM3CP/Screenshot_4.png)

## Formula <a href="#formula" id="formula"></a>

Fast EMA - Slow EMA

## Most useful cases <a href="#most-useful-cases" id="most-useful-cases"></a>

* **Divergence/Convergence** - Divergence/Convergence pattern is a form of price action when new high(low) on the price scale not confirmed with a new high of MACD. Such price and indicator’s behavior can be interpreted as the weakness of current existing trend.

![](https://content.gitbook.com/content/urdqk4sHwHHpr4J3s5P6/blobs/5FseW83kKpwtsK2LvRRZ/Screenshot_3.png)

* **Crossover** - Crossover pattern occurs when MACD value crosses the signal line upward or downward. This signal can be used as a trigger to open buy/sell position.
* **Crossing zero line** - this is a trend reversing signal and it can be very useful in case of determining a correction of existing trend, beginning of a new trend wave or starting a new trend.


# Awesome Oscillator

## Description <a href="#description" id="description"></a>

Awesome oscillator is an another kind of Moving average convergence/divergence indicator just with predefined input parameters. AO calculates the difference between 34 period SMA and 5 period SMA smoothed with 5 period moving average.

![](https://content.gitbook.com/content/urdqk4sHwHHpr4J3s5P6/blobs/AU50AkVrE4dabMlxVk4O/image.png)

## Formula <a href="#formula" id="formula"></a>

5 period SMA - 34 period SMA

## Most useful cases <a href="#most-useful-cases" id="most-useful-cases"></a>

* **Divergence/Convergence** - Divergence/Convergence pattern is a form of price action when new high(low) of the price not confirmed with a new high/low of AO. Such price and indicator’s behavior can be interpreted as the weakness of current existing trend.

![](https://content.gitbook.com/content/urdqk4sHwHHpr4J3s5P6/blobs/VV63DScmlOYGfO0owFW2/image%20\(1\).png)

* **Crossing zero line** - this is a trend reversing signal and it can be very useful in case of determining a correction of existing trend, beginning of a new trend wave or starting a new trend.


# Accelerator Oscillator

## Description <a href="#description" id="description"></a>

Accelerator Oscillator was introduced by Bill Williams in his book "Trading Chaos", according Bill Williams theory market price is latest element which will be changed and prior to this change the market driven forces will change its direction. The AC indicator measures acceleration and deceleration of these forces. If indicator rises it means that market is inbalanced now and buy power is greater than sell one and vice versa.

![](https://content.gitbook.com/content/urdqk4sHwHHpr4J3s5P6/blobs/DKddPqWXavfl6H3au599/image.png)

## Formula <a href="#formula" id="formula"></a>

MEDIAN PRICE = (HIGH + LOW) / 2 AO = SMA (MEDIAN PRICE, 5) - SMA (MEDIAN PRICE, 34) AC = AO - SMA (AO, 5)

Where: MEDIAN PRICE — median price; HIGH — the highest price of the bar; LOW — the lowest price of the bar; SMA — Simple Moving Average; AO — Awesome Oscillator.

​

## Most useful cases <a href="#most-useful-cases" id="most-useful-cases"></a>

* **Divergence/Convergence** - Divergence/Convergence pattern is a form of price action when new high(low) of the price not confirmed with a new high/low of AC. Such price and indicator’s behavior can be interpreted as the weakness of current existing trend.

![](https://content.gitbook.com/content/urdqk4sHwHHpr4J3s5P6/blobs/98wOY4c2yjA6tWBCkgWI/image%20\(1\).png)

* **Crossing zero line** - this is a trend reversing signal and it can be very useful in case of determining a correction of existing trend, beginning of a new trend wave or starting a new trend.


# %R Larry Williams

## Description <a href="#description" id="description"></a>

&#x20;Williams Percent Range, is an oscillator indicator that measures overbought and oversold of the price. It reflects the level of the close relative to the highest high for the look-back period. %R indicator is highly correlated with Stochastic, but in contrast, the Stochastic Oscillator reflects the level of the close relative to the lowest low. As a result, the Fast Stochastic Oscillator and Williams %R produce the exact same lines, the difference is just in the scaling of both indicators.

![](https://content.gitbook.com/content/urdqk4sHwHHpr4J3s5P6/blobs/qA0wi1e64uobWMDiMXCu/image%20\(1\).png)

## Formula <a href="#formula" id="formula"></a>

%R = (Highest High - Close)/(Highest High - Lowest Low) \* -100

Where:

Lowest Low = lowest low for the look-back period Highest High = highest high for the look-back period %R is multiplied by -100 correct the inversion and move the decimal.

​

## Most useful cases <a href="#most-useful-cases" id="most-useful-cases"></a>

* **Indication of overbought/oversold levels -** Traditional settings are -20 as the overbought threshold and -80 as the oversold threshold. When %R value rises above -20 this is a sell signal and when %R value falls below -80 is buy signal.
* **Divergence/Convergence** - Divergence/Convergence pattern is a form of price action when new high(low) of the price not confirmed with a new high/low of AO. Such price and indicator’s behavior can be interpreted as the weakness of current existing trend.

![](https://content.gitbook.com/content/urdqk4sHwHHpr4J3s5P6/blobs/69ZzluG4iceFXg8bJLzO/image.png)


# Momentum

## Description <a href="#description" id="description"></a>

&#x20;Momentum indicator shows an acceleration of price movement. From technical point of view it is the difference between current price and close price N-periods ago. Firstly introduced by John J. Murphy in "Technical Analysis of the Financial Markets" Momentum fixedly joined to traders arsenal. In spite of age this indicator is still actual and widely used

![](https://content.gitbook.com/content/urdqk4sHwHHpr4J3s5P6/blobs/3qYaCOfMOLGNdZdGQ9dK/image.png)

## Formula <a href="#formula" id="formula"></a>

Momentum = Close - Close(N-periods ago)

Where: Close - current close price Close(N-periods ago) - the close price N-periods ago

## Most useful cases <a href="#most-useful-cases" id="most-useful-cases"></a>

**Trend indicating -** crossing a zero line could be used as an indicator of a new trend wave.

![](https://content.gitbook.com/content/urdqk4sHwHHpr4J3s5P6/blobs/w4hVRjLNvZNZ4UvF89fE/image%20\(1\).png)

* **Divergence/Convergence** - Divergence/Convergence pattern is a form of price action when new high(low) of the price not confirmed with a new high/low of Momentum. Such price and indicator’s behavior can be interpreted as the weakness of current existing trend.

![](https://content.gitbook.com/content/urdqk4sHwHHpr4J3s5P6/blobs/GoK6EybWvRyMbPPfGGkP/image%20\(1\).png)


# Rate of Change

## Description <a href="#description" id="description"></a>

&#x20;Rate of change is the same indicator as Momentum and also shows an acceleration of price movement. But instead of Momentum, Rate of Change is expressed in percantage value. Simply put ROC measures the percentage change in price between the current price and the price N-periods in the past.

Rate of change can be used in variety of different ways. In addition to being used as a general trend or trend strength indicator, the ROC is also commonly used to find a divergence of a price that is a signal of a possible upcoming trend change.

![](https://content.gitbook.com/content/urdqk4sHwHHpr4J3s5P6/blobs/EkrWhpv9UNSMBwwLf68H/image.png)

## Formula <a href="#formula" id="formula"></a>

&#x20;ROC = (Close - Close(N-periods ago))/Close(N-periods ago) x 100

Where: **Close** - current close price **Close(N-periods ago)** - the close price N-periods ago

## &#x20;Most useful cases  <a href="#most-useful-cases" id="most-useful-cases"></a>

**Trend indicating -** crossing a zero line could be used as an indicator of a new trend wave.

![](https://content.gitbook.com/content/urdqk4sHwHHpr4J3s5P6/blobs/KGVCG26NkTFVr0v7xe4a/image%20\(1\).png)

**Divergence/Convergence** - Divergence/Convergence pattern is a form of price action when new high(low) of the price not confirmed with a new high/low of ROC. Such price and indicator’s behavior can be interpreted as the weakness of current existing trend.

![](https://blobscdn.gitbook.com/v0/b/gitbook-28427.appspot.com/o/assets%2F-LD6FsRvQ3jgwJIg6O7r%2F-LEiCcaLkLSDzK7fzQYN%2F-LEiFzSGukt96O3jPIiR%2Fimage.png?alt=media\&token=e5fe7d11-1581-464c-abd1-8e3f9567a81d)


# Relative Strength Index (RSI) Indicator

Relative Strength Index (RSI) is a momentum oscillator that measures the speed and change of price movements. The RSI oscillates between 0 and 100.

### What is the Relative Strength Index (RSI) Indicator? <a href="#what-is-the-relative-strength-index-rsi-indicator" id="what-is-the-relative-strength-index-rsi-indicator"></a>

**Relative Strength Index (RSI)** is a momentum oscillator that measures the speed and change of price movements. The RSI oscillates between 0 and 100. Traditionally the RSI is considered overbought when above 70 and oversold when below 30. Signals can be generated by looking for divergences and failure swings. RSI can also be used to identify the general trend.

![](https://content.gitbook.com/content/urdqk4sHwHHpr4J3s5P6/blobs/xECQoAM34oTve7hLRkwS/image.png)

### How the Relative Strength Index (RSI) Indicator works <a href="#how-the-relative-strength-index-rsi-indicator-works" id="how-the-relative-strength-index-rsi-indicator-works"></a>

* RSI is considered overbought when above 70 and oversold when below 30. These traditional levels can also be adjusted if necessary to better fit the asset. For example, if an asset is repeatedly reaching the overbought level of 70 you may want to adjust this level to 80.

  Note: During strong trends, the RSI may remain in overbought or oversold for extended periods.
* RSI also often forms chart patterns that may not show on the underlying price chart, such as double tops and bottoms and trend lines. Also, look for support or resistance on the RSI.
* In an uptrend or bull market, the RSI tends to remain in the 40 to 90 range with the 40-50 zone acting as support. During a downtrend or bear market, the RSI tends to stay between the 10 to 60 range with the 50-60 zone acting as resistance. These ranges will vary depending on the RSI settings and the strength of the security’s or market’s underlying trend.
* If underlying prices make a new high or low that isn't confirmed by the RSI, this divergence can signal a price reversal. If the RSI makes a lower high and then follows with a downside move below a previous low, a Top Swing Failure has occurred. If the RSI makes a higher low and then follows with an upside move above a previous high, a Bottom Swing Failure has occurred.

### Calculation of the Relative Strength Index (RSI) Indicator <a href="#calculation-of-the-relative-strength-index-rsi-indicator" id="calculation-of-the-relative-strength-index-rsi-indicator"></a>

The RSI is a fairly simple formula, but is difficult to explain without pages of examples. The basic formula is:

RSI = 100 – \[100 / ( 1 + (Average of Upward Price Change / Average of Downward Price Change ) ) ][<br>](https://help.quantower.com/analytics-panels/chart/technical-indicators/oscillators/rate-of-change)


# Commodity Channel Index (CCI)

## Description <a href="#description" id="description"></a>

&#x20;The Commodity Channel Index​ (CCI) is a momentum based technical indicator first time introduced by Donald Lambert in 1980, the most often user case is an identifying market cycles, reaching a condition of being overbought or oversold. From technical perspective CCI measures the change in an instrument's price relative to a pre-defined moving average (MA) of the price divided by 1.5% of a normal deviation (D) from that average.

![](https://content.gitbook.com/content/urdqk4sHwHHpr4J3s5P6/blobs/HNMP5dfAubFBWYssrgwi/1.png)

## Formula <a href="#formula" id="formula"></a>

CCI = (Price - MA)/0.015\*STD

Where: **Price** - current close price **MA** - selected N-period moving average **STD** - Standart deviation of price

## Most useful cases <a href="#most-useful-cases" id="most-useful-cases"></a>

* **Indication of overbought/oversold levels -** The most useful case of the commodity channel index is an identifying of price reversals, an instrument would be deemed oversold when the CCI dips below −100 and overbought when it exceeds +100. From oversold levels, a buy signal might be given when the CCI moves back above −100. From overbought levels, a sell signal might be given when the CCI moved back below +100.

![](https://content.gitbook.com/content/urdqk4sHwHHpr4J3s5P6/blobs/BREgcmyCCD6CpyMkRy23/2.png)

* **Divergence/Convergence** - Divergence/Convergence pattern is a form of price action when new high(low) of the price not confirmed with a new high/low of CCI. Such price and indicator’s behavior can be interpreted as the weakness of current existing trend.

![](https://content.gitbook.com/content/urdqk4sHwHHpr4J3s5P6/blobs/dW4XCz1JVhTMUec3M1hu/3.png)


# Moving averages


# Exponential Moving Average


# Simple Moving Average Indicator

### What is Simple Moving Average (SMA) Indicator?

Moving averages are one of the core indicators in technical analysis, and there are a variety of different versions. SMA is the easiest moving average to construct. It is simply the average price over the specified period. The average is called "moving" because it is plotted on the chart bar by bar, forming a line that moves along the chart as the average value changes. In trading practice commonly uses a combination of moving averages, combined together to the one group. This group then uses to determine a trend.

![](https://content.gitbook.com/content/urdqk4sHwHHpr4J3s5P6/blobs/WaEh5jHjYuDy9gHZnbKF/image.png)

## Formula <a href="#formula" id="formula"></a>

![](https://blobscdn.gitbook.com/v0/b/gitbook-28427.appspot.com/o/assets%2F-LD6FsRvQ3jgwJIg6O7r%2F-LEJgTBixsOJvvUPS6cD%2F-LEJmQKXJ0IDEgKsL9SQ%2Fimage.png?alt=media\&token=3a0a4561-2481-4b13-8f4a-2c9f5dd1d9db)

Most useful cases

* **Trend following** - group of SMA allows you to determing a new wave of trend or correction. Also it gives you information about the strenght of current trend wave, to do it trader needs to look at the distance between every SMA

![](https://content.gitbook.com/content/urdqk4sHwHHpr4J3s5P6/blobs/odOLMB3cnM0umQhv6Lyu/image%20\(1\).png)


# Volatility

{% content-ref url="/pages/IiAntEzumohhdWDAI90N" %}
[Average True Range](/analytics-panels/chart/technical-indicators/volatility/average-true-range)
{% endcontent-ref %}

{% content-ref url="/pages/putMgNSnkEZd5QcXpo22" %}
[Standard deviation](/analytics-panels/chart/technical-indicators/volatility/standard-deviation)
{% endcontent-ref %}


# Average True Range

## Description  <a href="#description" id="description"></a>

Average True Range is a volatility based indicator which describes the range of bars averaged for some period of time. Most common smoothing period is 14. ATR does not show any trend moving or reversing, it only measures volatility and it structure.

![](https://blobscdn.gitbook.com/v0/b/gitbook-28427.appspot.com/o/assets%2F-LD6FsRvQ3jgwJIg6O7r%2F-LEIyWSqV_jxSMP9EcKl%2F-LEJ1pigRz-tmXATS8u7%2FScreenshot_3.png?alt=media\&token=0fbb2549-e437-4a8d-acf0-a01f5b54f26b)

## Formula <a href="#formula" id="formula"></a>

![](https://blobscdn.gitbook.com/v0/b/gitbook-28427.appspot.com/o/assets%2F-LD6FsRvQ3jgwJIg6O7r%2F-LEIyWSqV_jxSMP9EcKl%2F-LEJ22BMBIW0m-alkISy%2Fimage.png?alt=media\&token=7d1056d5-3a04-4728-a5cb-d33adc7fa8b7)

![](https://blobscdn.gitbook.com/v0/b/gitbook-28427.appspot.com/o/assets%2F-LD6FsRvQ3jgwJIg6O7r%2F-LEIyWSqV_jxSMP9EcKl%2F-LEJ2EsXvhvZakhDo0lW%2Fimage.png?alt=media\&token=da0cf5df-eab9-4f34-9e28-a51c212fbbb3)

&#x20;The first ATR value is calculated using the arithmetic mean formula:

![](https://blobscdn.gitbook.com/v0/b/gitbook-28427.appspot.com/o/assets%2F-LD6FsRvQ3jgwJIg6O7r%2F-LEIyWSqV_jxSMP9EcKl%2F-LEJ2W9WDqbWKtVbRz7L%2Fimage.png?alt=media\&token=e5a56d5a-c0b5-41a6-be2c-a688c9ee7622)

## Most useful cases <a href="#most-useful-cases" id="most-useful-cases"></a>

* **Divergence/Convergence** - Divergence/Convergence pattern is a form of price action when new high(low) of the price not confirmed with a new high of ATR. This is a very good approach to find a weakness of existing trend

![](https://blobscdn.gitbook.com/v0/b/gitbook-28427.appspot.com/o/assets%2F-LD6FsRvQ3jgwJIg6O7r%2F-LEJ2Zt68VWe2gAN3KIn%2F-LEJ45oN8MvkTm5BCLGA%2Fimage.png?alt=media\&token=27ada11d-d213-4629-81ee-b24c095faaa4)

* **Confirmation of existing tendency -** if price and ATR rise together it can be interpreted as a confirmation of a strength of the trend

![](https://blobscdn.gitbook.com/v0/b/gitbook-28427.appspot.com/o/assets%2F-LD6FsRvQ3jgwJIg6O7r%2F-LEJ2Zt68VWe2gAN3KIn%2F-LEJ64FLFZhqN2gRGrZt%2Fimage.png?alt=media\&token=5b86c519-7bcc-4ff9-a441-09cdcfcbd366)


# Standard deviation

## Description  <a href="#description" id="description"></a>

Standart deviation indicator statisticy measures the dispersion of a price relative to its mean(mathemetical expectation) and is calculated as the square root of the variance. It is widely used in finance and trading regardless of asset class or market. For example, if trader calculates a standard deviation of his performance report as the result he will receive the measurement of volatility of his balance and equity, the higher STD means the he can expect bigger drawdown.

In case of price movement, higher STD means higher volatility of an instrument, for example if we compare two assets, the asset with higher standard deviation will be more risky for an investment.

![](https://blobscdn.gitbook.com/v0/b/gitbook-28427.appspot.com/o/assets%2F-LD6FsRvQ3jgwJIg6O7r%2F-LExBMZa7U_5fp6qqcXM%2F-LExFFMVXhCoyVv-RQ05%2Fimage.png?alt=media\&token=69c1ff3f-09aa-4e8f-b2dd-108563494c88)

## &#x20;Formula <a href="#formula" id="formula"></a>

![](https://blobscdn.gitbook.com/v0/b/gitbook-28427.appspot.com/o/assets%2F-LD6FsRvQ3jgwJIg6O7r%2F-LExBMZa7U_5fp6qqcXM%2F-LExGRmPDJtursr_lYaL%2Fimage.png?alt=media\&token=a67515f4-1bf3-4b47-ac76-a59e7f39dc23)

Where: **N** - period of calculation(number of observations) **x** - price value

​

## Most useful cases <a href="#most-useful-cases" id="most-useful-cases"></a>

* **Volatility measurement** - the most usefull case of STD usage is to determing a statistical volatility, understanding of this value is very usefull to find best positions of potential stop loss and take profit levels. It protects existing positions of small price fluctuations and random breakout of levels.
* **Divergence/Convergence** - Divergence/Convergence pattern is a form of price action when new high(low) of the price not confirmed with a new high of STD. This is a very good approach to find a weakness of existing trend.

![](https://blobscdn.gitbook.com/v0/b/gitbook-28427.appspot.com/o/assets%2F-LD6FsRvQ3jgwJIg6O7r%2F-LExBMZa7U_5fp6qqcXM%2F-LExInhwcXFRyRN7xiwj%2Fimage.png?alt=media\&token=1debe1ff-c205-41cd-abaa-72efbac2cf84)

​


# Trend

{% content-ref url="/pages/labWAJCqKJ8vfdtcMjnQ" %}
[ZigZag](/analytics-panels/chart/technical-indicators/trend/zigzag)
{% endcontent-ref %}


# ZigZag

## Description <a href="#description" id="description"></a>

ZigZag is a trend following indicator which allows to determing trend swings. A combination of ZigZag highs and lows can be used as a support or resistance level. Also it helps to identify significant changes in price and filter out short-term fluctuations.

![](https://blobscdn.gitbook.com/v0/b/gitbook-28427.appspot.com/o/assets%2F-LD6FsRvQ3jgwJIg6O7r%2F-LEs3fQFk5ZPPjV0oURa%2F-LEs9LYouHNHFhKk9kap%2Fimage.png?alt=media\&token=a7f1f078-9fbe-4301-a20c-07b2719f0a5e)

## Formula <a href="#formula" id="formula"></a>

ZigZag finds extremums in price movement. These extremums reflect the diviations of price that are more than setted value. By default value for a ZigZag is 5%, it will ensure that only price fluctuations of 5% or more will be shown in the chart.

​

## Most useful cases <a href="#most-useful-cases" id="most-useful-cases"></a>

* **Determing swings** - the most common case of ZigZag usage is an eliminating a small price fluctuations and paying attention on huge price swings.
* **Support/Resistant levels** - ZigZag also is very helpful in finding levels of support and resistance, to do it traders generally analyze a price of ZigZag swing and combine closest swings together in one price level


# Volume analysis tools

3rd Dimension trading platform provides [**Volume analysis tools**](/analytics-panels/chart/volume-analysis-tools), an advanced analytical functionality, which allows you to see the traded volume at each price level, assess the balance between buyers and sellers and understand the intentions of traders regarding the future price.

{% embed url="<https://youtu.be/w5nad7j1Ycc>" %}

Volume analysis tools include proprietary and well-known analytics, which we’ll explore in the further articles:

* **​**[**Cluster chart**](/analytics-panels/chart/volume-analysis-tools-or-volume-profiles-or-footprint-chart-or-vwap/cluster-chart) (or Footprint chart)
* ​[**Set of volume profiles**](/analytics-panels/chart/volume-analysis-tools-or-volume-profiles-or-footprint-chart-or-vwap/volume-profiles) — Step, Right, Left and Custom volume profiles
* ​[**Time Statistics**](/analytics-panels/chart/volume-analysis-tools-or-volume-profiles-or-footprint-chart-or-vwap/time-statistics) (known as Bar Statistics) — in table form
* ​[**Time Histogram**](/analytics-panels/chart/volume-analysis-tools-or-volume-profiles-or-footprint-chart-or-vwap/time-histogram) — in form of vertical histogram
*

&#x20;The screenshot below shows how you can activate the toolbar of volume analysis tools:

![](https://content.gitbook.com/content/urdqk4sHwHHpr4J3s5P6/blobs/zp8aU8uzlMMgbAuFySZo/Volume%20analysis%20tools.png)

{% hint style="info" %}
**Green color** indicates that selected volume analysis tool has entirely downloaded the data. \
**Yellow color** indicates that selected tool is downloading the data.
{% endhint %}

### Data types of Volume Analysis Tools

All volume analysis tools have the same **Data Types**, which can be specified in the settings:

* **Trades** — it's the number of contracts (trades) that executed at each price level.
* **Buy (or Sell) trades** — it's the number of Buy (or Sell) trades that executed at each price level.
* **Volume** — the total size of all positions that executed at each price level or price range.
* **Buy (or Sell) Volume** — the total size of all Buy (or sell) positions that executed at each price level or price range.
* **Buy (or Sell) Volume, %** — shows how many percent of the total volume relates to Buy (or Sell) trades
* **Delta and Delta %** — shows the difference in traded Volume between Buyers and Sellers. It allows evaluating who controls the price on the market at a given time. Delta % = Delta / Volume \* 100
* **Cumulative Delta** — the data is built by adding the current delta value with each subsequent delta value for the certain period of time (or number of bars).
* **Average size** — the average volume of the position that was executed at a certain price or price range.
* **Average Buy size** — the average volume of a Buy position that was executed at a specific price or price range.
* **Average Sell size** — the average volume of a Sell position that was executed at a specific price or price range.
* **Max one trade volume (value and %)** — shows the maximum volume of a single trade that has executed at a certain price or price range (depending on the Custom Step (ticks) setting).
* **Filtered volume (value and %)** — this parameter displays volumes that exceed the size specified in the filter. If the volume size is smaller than the one specified in the filter, then the values will be zero.
* **Buy (or Sell) filtered volume** — the parameter displays Buy (or Sell) volumes that exceed the size specified in the filter.


# Power Trades

**​**[**Volume analysis tools**](/analytics-panels/chart/volume-analysis-tools) allow you to understand the causes of price movement, clarify and confirm support and resistance levels, as well as assess the imbalance between buyers and sellers. But volume tools are link to a specific time (timeframe), not allowing to see an execution of large orders at the moment.

Using **Power Trades** you can see the execution of a large number of orders in a very short time, which will affect the price change with a high probability.

## What is **Power Trades** show? <a href="#what-is-power-trades-show" id="what-is-power-trades-show"></a>

First, let's take a look at a few examples.

![Power Trades tool shows huge executed trades for the short time](https://content.gitbook.com/content/urdqk4sHwHHpr4J3s5P6/blobs/cDwJPerqS9mZ6Receiz6/power%20trades%204.png)

## Main settings of Power Trades <a href="#main-settings-of-power-trades" id="main-settings-of-power-trades"></a>

![Main settings of Power Trades tool](https://content.gitbook.com/content/urdqk4sHwHHpr4J3s5P6/blobs/zz4sUZX26KRh9OWFkeGA/Power%20Trades%20settings.png)

The following settings are involved in the calculation of the indicator, and directly affect the results.

* **Min Trade Volume** — the indicator calculation takes into account the executed trades, each with the size equal to or greater than the set value. For example, we can set 100 contracts, and all trades with the volume not less than the specified one will be taken into account in the calculation of the zone.
* **Max Trade Volume** — the indicator calculation takes into account the executed trades, each with the size not exceeding the set value.
* **Total Volume** — the minimum value of the volume that should be traded during the specified time interval
* **Time Interval, sec** — the time over which the Total Volume should be traded
* **Basis Volume Interval, sec** — this parameter shows how much % took the traded volume in the total volume for the specified time.
* **Zone Height, ticks** — this parameter will show only those zones where the height is less than or equal to the specified value (in ticks).
* **Level2 level count** — the number of levels that are involved in the calculation of **Imbalance** and the *Level 2 Ratio* column in the table of results.
* **Filter by Delta,%** — the parameter will show zones that have a delta value greater than or equal to that specified in the setting. The value must be specified by module, so the table will show both positive and negative delta values. *We recommend to* ***pay attention to the zones with the delta above/below 50%*** (taking into account the specifics of each trading instrument).

Settings that do not affect the indicator calculation. These are mostly visual and sound settings

* **Play alert sound** — the option turns on / off the sound signal when a new zone appears.
* **Area color** — set color for all found areas on the chart
* **Highlight area color** — set color for the selected area on the chart
* **Show Market Depth** — the option shows / hides the Market Depth at the bottom of the table.


# Drawing tools

{% embed url="<https://youtu.be/ZRor75lr9ow>" %}
How to add favorite drawing tools to the side bar
{% endembed %}


# Volume Analysis Tools | Volume Profiles | Footprint chart | VWAP

Volume analysis is a powerful trading technique that allows analyzing the distribution of the trading volume at each price level at a certain period of time.

3rd Dimension trading platform provides[ **Volume analysis tools**,](/analytics-panels/chart/volume-analysis-tools) an advanced analytical functionality, which allows you to see the traded volume at each price level, assess the balance between buyers and sellers and understand the intentions of traders regarding the future price

Volume analysis tools include proprietary and well-known analytics:

* [**Cluster Chart**](https://help.quantower.com/analytics-panels/chart/volume-analysis-tools/cluster-chart) (a.k.a. Footprint chart or OrderFlow chart)
* [**Volume Profiles**](https://help.quantower.com/analytics-panels/chart/volume-analysis-tools/volume-profiles) — Step, Right, Left and Custom volume profiles
* [**Time Statistics**](https://help.quantower.com/analytics-panels/chart/volume-analysis-tools/time-statistics) — volume data per each bar in table form
* [**Time Histogram**](https://help.quantower.com/analytics-panels/chart/volume-analysis-tools/time-histogram) — volume data per each bar in the form of a vertical histogram
* [**Custom VWAP (Anchored VWAP)**](broken://pages/-M3CG0Avcbhzkycuck4B) — can be attached to any selected bar as a starting calculation point
* [**VWAP**](broken://pages/-Ll6_Ni3_x6rywj03Ow_) — multiple VWAP lines for a single chart
* [**Historical Time & Sales**](https://help.quantower.com/analytics-panels/chart/volume-analysis-tools/historical-time-and-sales) — the table of all trades for the any selected bar

{% embed url="<https://www.youtube.com/watch?embeds_referring_euri=https://cdn.iframe.ly/&feature=emb_imp_woyt&source_ve_path=OTY3MTQ&v=w5nad7j1Ycc>" %}

&#x20;The GIF below shows how you can activate the toolbar of volume analysis tools:


# Cluster chart

Cluster or Footprint chart is a professional analytical tool that shows OHLC prices and trading volume on a single chart.

{% embed url="<https://youtu.be/g89M31opW-Q>" %}

## What is Cluster chart? <a href="#what-is-cluster-chart" id="what-is-cluster-chart"></a>

**Cluster chart**, known as Footprint chart in other trading platforms, is an advanced chart type that shows a comprehensive view of the candle chart. It allows to look inside the price and see all market actions. Cluster chart combines several important characteristics like time, OHLC prices, trading volume, number of buy and sell trades.

Using this information, a trader can evaluate:

* trading volume, which executed for each price
* zones of maximum volume accumulation
* zones of high trading interest (the maximum number of trades)
* the number of buyers and sellers at each price level

![General view of Cluster chart which shows Trades and Delta at once](https://content.gitbook.com/content/urdqk4sHwHHpr4J3s5P6/blobs/pkaWvSpNkW8885uN2Wg4/cluster%20chart%20general%20view.png)

## How to enable cluster chart? <a href="#how-to-enable-cluster-chart" id="how-to-enable-cluster-chart"></a>

Before activating a cluster chart, you need to enable the Volume Analysis Toolbar. To do this, in the upper right corner of the chart panel, click on the "***Magnifier***" icon. A toolbar with Volume Analysis tools will appear at the bottom of the chart — *Cluster,* [*Step Profile, Left Profile, Right Profile*](/analytics-panels/chart/volume-analysis-tools-or-volume-profiles-or-footprint-chart-or-vwap/volume-profiles)*,* [*Time Statistics*](/analytics-panels/chart/volume-analysis-tools-or-volume-profiles-or-footprint-chart-or-vwap/time-statistics)*,* [*Time Histogram*](/analytics-panels/chart/volume-analysis-tools-or-volume-profiles-or-footprint-chart-or-vwap/time-histogram)*,* [*Historical Time & Sales*](/analytics-panels/chart/volume-analysis-tools-or-volume-profiles-or-footprint-chart-or-vwap/historical-time-and-sales)*,* [*Custom Volume Profile*](/analytics-panels/chart/volume-analysis-tools-or-volume-profiles-or-footprint-chart-or-vwap/volume-profiles).

1. Click on the **Cluster** and Enable it
2. Select the Data type (you can select one or two different data types at once)
3. Customize data visualization
4. Use advanced settings (gear icon) for more detailed chart customization.

![Here is how you can activate Cluster chart in 3rd Dimension platform](https://content.gitbook.com/content/urdqk4sHwHHpr4J3s5P6/blobs/BDZ9Ol971HD9xGmjPoAd/how%20to%20enable%20cluster%20chart.gif)

{% hint style="info" %}
For more efficient analysis with cluster chart, you can display two different data types on one bar at once.
{% endhint %}

## General settings of cluster chart <a href="#general-settings-of-cluster-chart" id="general-settings-of-cluster-chart"></a>

Cluster chart has various settings allowing to display volume data from different sides. For example, you can choose different types of data for each bar, as well as configure colors, which will simplify the perception and analysis of volumes, trades, etc.

![Select different data types for Cluster chart](https://content.gitbook.com/content/urdqk4sHwHHpr4J3s5P6/blobs/B4ptG2VoUlbx0Xhd1oH9/cluster%20data%20type.gif)

The main Data Types for cluster chart:

* **Trades** — it's the number of contracts (trades) that executed at each price level.
* **Buy (or Sell) trades** — it's the number of Buy (or Sell) trades that executed at each price level.
* **Volume** — the total size of all positions that executed at each price level or price range.
* **Buy (or Sell) Volume** — the total size of all Buy (or sell) positions that executed at each price level or price range.
* **Buy (or Sell) Volume, %** — shows how many percent of the total volume relates to Buy (or Sell) trades
* **Delta and Delta %** — shows the difference in traded Volume between Buyers and Sellers. It allows evaluating who controls the price on the market at a given time. Delta % = Delta / Volume \* 100
* **Average size** — the average volume of the position that was executed at a certain price or price range.
* **Average Buy size** — the average volume of a Buy position that was executed at a specific price or price range.
* **Average Sell size** — the average volume of a Sell position that was executed at a specific price or price range.
* **Max one trade volume (value and %)** — shows the maximum volume of a single trade that has executed at a certain price or price range (depending on the Custom Step (ticks) setting).
* **Filtered volume (value and %)** — this parameter displays volumes that exceed the size specified in the filter. If the volume size is smaller than the one specified in the filter, then the values will be zero.
* **Buy (or Sell) filtered volume** — the parameter displays Buy (or Sell) volumes that exceed the size specified in the filter.

## How to set the filtered volume? <a href="#how-to-set-the-filtered-volume" id="how-to-set-the-filtered-volume"></a>

For all volume analysis tools, there are general settings that allow you to set Filtered volume, and configure the step for aggregating volume data. On highly liquidity assets like Bitcoin or futures on the S\&P500, the trading volume for a trading session is large. Set the minimum volume values that will be displayed on the chart. This will allow you to focus on significant price levels and more clearly see zones of support/resistance.

{% hint style="info" %}
Each instrument has individual settings for the filtered volume depending on liquidity.
{% endhint %}

![Filtered volume in general settings of Volume Analysis](https://content.gitbook.com/content/urdqk4sHwHHpr4J3s5P6/blobs/J1c34fupfokB28Eayeqe/Filtered%20volume.png)

Select **Filtered Volume** as the data type in clusters to display them on the chart. All values that are less than the filtered volume are presented as zeros.

## What is Custom step and how to set it properly? <a href="#what-is-custom-step-and-how-to-set-it-properly" id="what-is-custom-step-and-how-to-set-it-properly"></a>

Cluster chart shows volume data at each price level for a specified period. But with a large number of levels, the cluster chart becomes difficult to read.

**Custom step** summarizes the volume data of as many price levels as specified in the setting. By default, the value of the custom step is set to 1 tick, which means the volume data are shown at each price level.


# Volume profiles

**Volume Profile** displays the trading activity over a specific time period at certain price levels. Meaning, it shows what was bought and sold at those current levels, and displays them in a histogram on the side of your chart. Volume Profile allows you to see the zones of maximum trading interest, and as a consequence, the "true" support/resistance levels.

3rd Dimension platform offers four types of Volume profiles:

* [**Step Volume Profile**](#step-volume-profile)
* [**Left Volume Profile**](#left-and-right-volume-profiles)
* [**Right Volume Profile**](#left-and-right-volume-profiles)
* [**Custom Volume Profile**](#custom-volume-profile)

## Step Volume Profile <a href="#step-volume-profile" id="step-volume-profile"></a>

Step profile displays volume profiles with a certain time step. For example, set the step period to 1 hour, and you will see profiles with uniform hourly steps on the graph. By changing the [**data types**](/analytics-panels/chart/volume-analysis-tools#data-types-of-volume-analysis-tools), you will see the distribution of the trading volume, the executed trades, as well as the delta for each hour of the trading session.

You can enable Step Profile through the volume analysis toolbar or their settings.

![Here is how you can activate Step Profile in 3rd Dimension platform](https://content.gitbook.com/content/urdqk4sHwHHpr4J3s5P6/blobs/m8yyFrHWwTAsY8ZVKOan/step%20profile.gif)

### **General settings of step profile** <a href="#general-settings-of-step-profile" id="general-settings-of-step-profile"></a>

![Main settings of Step Volume Profile tool](https://content.gitbook.com/content/urdqk4sHwHHpr4J3s5P6/blobs/ZPKTKXBpgYwYwcGKuGr4/step%20profile%20settings.gif)

**Step period & Step coefficient** – determines the step to build the profile. Step period has four types –*Minute, Hour, Day, Week*.

* **Data type** – choose any of the [**20+ data types**](/analytics-panels/chart/volume-analysis-tools#data-types-of-volume-analysis-tools) to build a step profile
* **Histogram position** – places the profile on the left or right side relative to the starting point.
* **Histogram label position** – determines the position of the data value: *left, right or none*
* **Show Value Area** – shows the price area with 70% of trading activity for the specified time range. The value of 70% is set by default, but the user can change it at his discretion.
* **Show Value Area borders** – shows the outer limits of the Value Area as dotted lines
* **Highlight maximum value** – levels with the maximum value are highlighted with the specified color
* **Show totals** – this option summarizes the data based on which the profile is built.

![Step profile with various data types](https://content.gitbook.com/content/urdqk4sHwHHpr4J3s5P6/blobs/cXfjr7fviRDU6RwrbGkJ/step%20profile%20data%20types.gif)

## Left & Right Volume Profiles <a href="#left-and-right-volume-profiles" id="left-and-right-volume-profiles"></a>

**Left** and **Right volume profile** can be placed on the left and right side of the chart respectively. For example, you can set the delta data on one profile, and on the other the total volume for the same period of time. You can **combine several profiles** that are built on different time periods into one combo profile and put it on left or right chart position.

![3rd Dimension allows to place multiple volume profiles with different data types](https://content.gitbook.com/content/urdqk4sHwHHpr4J3s5P6/blobs/5AEW1jU3MoeTk7hNLzK6/left_right%20profile.png)

## Custom Volume Profile <a href="#custom-volume-profile" id="custom-volume-profile"></a>

Custom profile allows you to create a profile for any time range. For instance, you want to see the distribution of the delta on the flat chart or for the impulse bar. As with other volume analysis tools, you can choose any available data types for display.

![Custom volume profile can be applied to any range](https://content.gitbook.com/content/urdqk4sHwHHpr4J3s5P6/blobs/ZDPcUFEE6Qpqf9gSXrjW/new%20custom%20profile.gif)

After you have placed a custom profile on the chart, a control panel with five options will appear next to it.

![Control panel for custom volume profile](https://content.gitbook.com/content/urdqk4sHwHHpr4J3s5P6/blobs/FHv2Li5rWuYLZIqeodk4/image.png)

Dublicate profile with the same range and settings

* Move profile to the background or foreground
* Lock current position of the profile. Prohibits the profile movement.
* **Additional settings** for selected profile
* Delete selected profile

## Additional settings for custom profile <a href="#additional-settings-for-custom-profile" id="additional-settings-for-custom-profile"></a>

In addition to the settings for quick management of custom profile, there are additional settings. Let's take a closer look at what you can customize.

![Additional settings for custom volume profile](https://content.gitbook.com/content/urdqk4sHwHHpr4J3s5P6/blobs/g0dxYPtxMkieoCdhwqrs/custom%20profile%20settings.gif)

There are a lot of various settings, but the most intersting are:

* **Value Area** — shows the price area with 70% of trading activity for the specified time range. The value of 70% is set by default, but the user can change it at his discretion.
* **POC Ray** — extends the level of maximum volume (Point of Control) to the price scale
* **Show Total** — shows/hides the total number under certain profile
* **Custom step (ticks)** summarizes the volume data of as many price levels as specified in the setting. By default, the value of the custom step is set to 1 tick, which means the volume data are shown at each price level.


# Time statistics

**Time Statistics** tool (sometimes called as ***Bar Statistics***) shows important volumetric values for each bar in a static grid-like fashion.

{% embed url="<https://youtu.be/9csuCApvIXg>" %}

Click on the **Time Statistics** button to activate it and to add the necessary data type. Also, via a right click in the side scale section the individual statistic values could be enabled / disabled '*on the fly*'.

![Time Statistics (or Bar Statistics) shows extended volume data for each bar](https://content.gitbook.com/content/urdqk4sHwHHpr4J3s5P6/blobs/XHVoL3wK4LWdi8pILzYg/Time%20or%20Bar%20statistics.png)

The main Data Types for Time Statistics:

* **Trades** — it's the number of contracts (trades) that executed at each price level.
* **Buy (or Sell) trades** — it's the number of Buy (or Sell) trades that executed at each price level.
* **Volume** — the total size of all positions that executed at each price level or price range.
* **Buy (or Sell) Volume** — the total size of all Buy (or sell) positions that executed at each price level or price range.
* **Buy (or Sell) Volume, %** — shows how many percent of the total volume relates to Buy (or Sell) trades
* **Delta and Delta %** — shows the difference in traded Volume between Buyers and Sellers. It allows evaluating who controls the price on the market at a given time. Delta % = Delta / Volume \* 100
* **Cumulative Delta** — the data is built by adding the current delta value with each subsequent delta value for the certain period of time (or number of bars).
* **Average size** — the average volume of the position that was executed at a certain price or price range.
* **Average Buy size** — the average volume of a Buy position that was executed at a specific price or price range.
* **Average Sell size** — the average volume of a Sell position that was executed at a specific price or price range.
* **Max one trade volume (value and %)** — shows the maximum volume of a single trade that has executed at a certain price or price range (depending on the Custom Step (ticks) setting).
* **Filtered volume (value and %)** — this parameter displays volumes that exceed the size specified in the filter. If the volume size is smaller than the one specified in the filter, then the values will be zero.
* **Buy (or Sell) filtered volume** — the parameter displays Buy (or Sell) volumes that exceed the size specified in the filter.


# Time histogram

**Time Histogram** is similar to [Time Statistics](/analytics-panels/chart/volume-analysis-tools-or-volume-profiles-or-footprint-chart-or-vwap/time-statistics) tool that shows volume data as a vertical histogram for each bar. But unlike Time statistics, it allows you to visually evaluate the data for each bar, not only by colors but also by the shape of the histogram.

![Time histogram on the chart — general view](https://content.gitbook.com/content/urdqk4sHwHHpr4J3s5P6/blobs/qETcPdXuAuGgW9kukHPE/time%20histogram%20general%20view.png)

Click on the **Time Histogram** and switch the button **"Enable"** to activate the functionality on the chart. Time Histogram supports an extensive list of Data types that you can change either in the settings or directly in the activation mode.

![Main settings of Time Histogram tool](https://content.gitbook.com/content/urdqk4sHwHHpr4J3s5P6/blobs/9HD3s9Z9SvqdlPOWSCGT/time%20histogram%20settings.png)

**Enable Time Histogram** — activates the functionality to display on the chart. After you activate it, the loading process of tick and volume data will begin. The yellow color will indicate that data is loading. Green color means that the data for the selected history depth is fully downloaded.

![Loaded data (green color); data is loading (yellow color)](https://content.gitbook.com/content/urdqk4sHwHHpr4J3s5P6/blobs/LxzZB7jV7xkMJ8Ob1fyc/time%20histogram%20loading%20data.gif)

**Height of Histogram, %** — determines what part of the chart area will be occupied for displaying volume data. If you set the value to 50%, then half of the chart area will be filled by Time Histogram data.

![Set the height of time histogram (%) that will fill the chart area](https://content.gitbook.com/content/urdqk4sHwHHpr4J3s5P6/blobs/hylUfCCySBhcM5UQJjIy/Height%20of%20Time%20Histogram.png)

**Data types** — various types of volume data that can be displayed on a chart. There are trades, volume, bid & ask trades and volume, filtered data, etc. The full list with descriptions of these data types you can find in our Help documentation that describes general information about [**Volume Analysis Tools**](/analytics-panels/chart/volume-analysis-tools).

* **Value label and Data type color** — here you set the color settings for the font and the histogram, respectively.

## The main Data Types for Time Histogram: <a href="#the-main-data-types-for-time-histogram" id="the-main-data-types-for-time-histogram"></a>

* **Trades** — it's the number of contracts (trades) that executed at each price level.
* **Buy (or Sell) trades** — it's the number of Buy (or Sell) trades that executed at each price level.
* **Volume** — the total size of all positions that executed at each price level or price range.
* **Buy (or Sell) Volume** — the total size of all Buy (or sell) positions that executed at each price level or price range.
* **Buy (or Sell) Volume, %** — shows how many percent of the total volume relates to Buy (or Sell) trades
* **Delta and Delta %** — shows the difference in traded Volume between Buyers and Sellers. It allows evaluating who controls the price on the market at a given time. Delta % = Delta / Volume \* 100
* **Cumulative Delta** — the data is built by adding the current delta value with each subsequent delta value for the certain period of time (or number of bars).
* **Average size** — the average volume of the position that was executed at a certain price or price range.
* **Average Buy size** — the average volume of a Buy position that was executed at a specific price or price range.
* **Average Sell size** — the average volume of a Sell position that was executed at a specific price or price range.
* **Max one trade volume (value and %)** — shows the maximum volume of a single trade that has executed at a certain price or price range (depending on the Custom Step (ticks) setting).
* **Filtered volume (value and %)** — this parameter displays volumes that exceed the size specified in the filter. If the volume size is smaller than the one specified in the filter, then the values will be zero.
* **Buy (or Sell) filtered volume** — the parameter displays Buy (or Sell) volumes that exceed the size specified in the filter.


# Historical Time & Sales

Historical Time & Sales tool shows all trades for the selected bar in the form of Time & Sales. Once you have activated the Historical T & S and chose the desired historical bar on the chart, all its trades will be shown in the table in the order of their execution.

![Historical Time & Sales](https://content.gitbook.com/content/urdqk4sHwHHpr4J3s5P6/blobs/lHHbszK2L6TsrwTqFSqM/historical%20TS.gif)

Turn on "**Bar Select"** button and select the bar (candle) for which you want to download data. When this mode is turned off, you can continue to work with the chart, while the downloaded data will remain in the table.

## Table actions <a href="#table-actions" id="table-actions"></a>

By default, the table displays five columns — *Time, Last price, Trade Size, Aggressor flag, Tick direction*. You can move any column of the table left or right, as well as sort or filter data.

![Context menu of the table of Historical Time & Sales](https://content.gitbook.com/content/urdqk4sHwHHpr4J3s5P6/blobs/tBsHbE6BS7Myc0mW1PP6/context%20menu%20historical%20ts.png)

By right-clicking on the table, a context menu will appear with several options:

* **Clear table**. Delete all data from the table
* **Export data** to external .csv or .html file
* **Column visibility.** Enable or disable columns in the table


# Watchlist

The Watchlist panel is the standard table-based panel, representing a various trading info for the specified list of symbols. The list of symbols can be customized using the symbol lookup screen, available by pressing **\[ + ]** button on the toolbar, or from table context menu — “***Add symbols***“ option.

![](https://content.gitbook.com/content/urdqk4sHwHHpr4J3s5P6/blobs/6RumLkha7VHeu5fhx1AO/watchlist.png)

Watch the required symbol info using Watchlist panel

Each symbol added to watchlist can be removed via the context menu on the symbol’s row. You can also clear all list via the context menu.

When you add a symbol, that is already presented in current list, it will be added to the end of the list thus making a duplicates.

## Favorite lists <a href="#favorite-lists" id="favorite-lists"></a>

You may want to have a possibility to save several lists for Watchlist panel. To save some list as Favorite, you can use the \[ Saved lists ] button on the toolbar. If you have no saved lists yet, it will open a “Save current list” popup, where you can set the name for the list, that you are saving.

![](https://blobscdn.gitbook.com/v0/b/gitbook-28427.appspot.com/o/assets%2F-LD6FsRvQ3jgwJIg6O7r%2F-LHJBJoGspYTMs023Olp%2F-LHJCEyBtVsQjr0QR334%2Fwatchlist_save.png?alt=media\&token=8aaf95cd-0714-4b37-89b7-328dba7be8ff)

Set the name for the Favorite list

Once you press the **\[ SAVE ]** button, the new list will be added to the Favorites and became available from the ***“Saved lists”*** drop-down on the toolbar.

![](https://blobscdn.gitbook.com/v0/b/gitbook-28427.appspot.com/o/assets%2F-LD6FsRvQ3jgwJIg6O7r%2F-LUW-CxrdQyHWtgMS1h_%2F-LUW1DeZB7X2CnyWP3A7%2FLists%20in%20the%20Watchlist.png?alt=media\&token=4f6b6a46-709f-4c6d-aad5-50bb3eb5b0c1)

Favorite lists drop-down

Using the ***“Favorite lists”*** drop-down, you can manage the current saved lists (edit name, remove) and initiate the current list save.

Please notice. When you click on any of favorite lists it will be added below the current list. If you want to see the selected list only, you should clear the Watchlist first.

## Indicators <a href="#indicators" id="indicators"></a>

The Watchlist panel supports the indicators value display in separate columns. In order to add some indicator, thare are two ways to to it:

* right-click on watchlist table and proceed to ***"Indicators" -> "Add indicator"*** option. This opens an indicators lookup screen, where you should select the required one.

![](https://content.gitbook.com/content/urdqk4sHwHHpr4J3s5P6/blobs/TPIf27WREurkkOrqkSml/indicators%20watchlist%20first%20way.png)

Indicators in watchlist are very useful

* through the icon ***"Add indicator"*** in the upper right corner of the Watchlist panel

![](https://blobscdn.gitbook.com/v0/b/gitbook-28427.appspot.com/o/assets%2F-LD6FsRvQ3jgwJIg6O7r%2F-LUW-CxrdQyHWtgMS1h_%2F-LUW9frJUm69rf-o-DMD%2Findicators%20watchlist%20second%20way.png?alt=media\&token=988a92fd-48b9-4c8e-8c74-2e25bb22f4fd)

There are two ways to add indicators in the panel

When you select an indicator, you will see the new column (with the selected indicator name) added to the right side of watchlist table. To remove indicator, go to the Indicators category in the context menu and click the ***“Remove Indicator Name”*** option.

{% hint style="info" %}
Some indicators need time to calculate their values. You will see the “Initializing...” text in such cells.
{% endhint %}

If you have created (or added) a custom indicator in the platform and want to add it to the Watchlist panel, you need to add an additional parameter to the code. More information about how to do this is given in our guide "[**Adding a custom indicator to Watchlist**](/analytics-panels/watchlist)".


# Time & Sales

## What is Time and Sales <a href="#what-is-time-and-sales" id="what-is-time-and-sales"></a>

**Time & Sales** panel displays all trades that occur for selected instrument and provides details for each trade including date, time, price, and quantity. Each line is color-coded to indicate whether the trade was a result of an aggressive buyer or seller.

Time & Sales panel keeps a running record of trades for selected instruments displayed in chronological order. Each new entry is added to the top of the list, causing the panel screen to auto-scroll downward.

![Time & Sales panel in action - BTC/USD via Bitfinex connection](https://blobscdn.gitbook.com/v0/b/gitbook-28427.appspot.com/o/assets%2F-LD6FsRvQ3jgwJIg6O7r%2F-LMgTK3667YaMXaKhtC7%2F-LMgXK8s6OConIbMrZzH%2FTime%26Sales.gif?alt=media\&token=f81067f2-548e-4151-9005-5187a445d81b)

## General settings <a href="#general-settings" id="general-settings"></a>

The basic settings in Time & Sales are similar to the parameters of most panels in 3rd Dimension— full flexibility in color settings, fonts, columns visibility, data position relative to the column, etc.

![General settings of Time & Sales panel](https://blobscdn.gitbook.com/v0/b/gitbook-28427.appspot.com/o/assets%2F-LD6FsRvQ3jgwJIg6O7r%2F-LMgTK3667YaMXaKhtC7%2F-LMgZf1UtlK6DBIeEoKP%2FTime%26Sales%20general%20settings.png?alt=media\&token=91d9ad95-81f9-4023-b512-257f677d5657)

But some settings are unique for this panel:

* **Rows limit** — this is the number of lines that will be displayed in the table, to save the memory of your computer. When the number of lines exceeds the specified value, the old values will be deleted as new ones appear
* **Time format** — allows setting the time accuracy for executed trades.
* **Coloring scheme** — this option sets the color scheme for all rows of the table, depending on the selected condition: If you chose **“By Aggressor Flag”**, then for the trades with the Buy direction the line will be blue, and for the Sell trades, the line will be red. If the Aggressor flag is not defined (None) then the color lime will be white.

  If you selected **“By Tick Direction”**, then the lines will be colored according to the change in the last price.

## Export Data <a href="#export-data" id="export-data"></a>

Time & Sales panel allows exporting executed trades to *CSV* or *HTML* files for further analysis. Soon we will add the ability to auto-update the data directly in the external file via DDE and RTD functions.

![T & S panel allows exporting data into external files](https://blobscdn.gitbook.com/v0/b/gitbook-28427.appspot.com/o/assets%2F-LD6FsRvQ3jgwJIg6O7r%2F-LMh0wM_Hye_-2UNcoOC%2F-LMh5cMPEfRtzcuVwp6A%2FExport%20in%20T%26S.png?alt=media\&token=703434bd-3e53-42fd-b23a-22326fc652b5)

Select the "**Export Data**" in the panel's menu

* Select the necessary data that you want to export and click on the **\[Export File]** button
* Specify the type of files and the path to save it

## Setup Actions - Filters & Actions <a href="#setup-actions-filters-and-actions" id="setup-actions-filters-and-actions"></a>

We wrote about this functionality in the [**Advanced table filters and actions**](/general-settings/table-management#advanced-table-filter) section, which explains in details the process of adding filters and creating different notifications. Here we briefly describe the filtering process in the table and the settings of various actions.

### Filtering in the Time & Sales table <a href="#filtering-in-the-time-and-sales-table" id="filtering-in-the-time-and-sales-table"></a>

Rows in the table can be filtered by some data value in their column. There are two ways to apply the filtering:

* **Quick filtering** can be accessed by clicking the “***Filter***” icon in any table column’s header.

![Quick filtering per column](https://blobscdn.gitbook.com/v0/b/gitbook-28427.appspot.com/o/assets%2F-LD6FsRvQ3jgwJIg6O7r%2F-LSZlUr_Myk0rKIIPYb3%2F-LSZtsdnR8ZXyAorsvkj%2FQuick%20filtering.png?alt=media\&token=ccff8243-c69e-427c-8825-00c8ce9e1818)

Once you select some option — the table rows will be filtered to that ones, containing the selected value. Quick filter can be cancelled by pressing “***Cancel filtering***” option.

{% hint style="info" %}
Quick filtering can be applied only to one column of the table. For filtering multiple columns, we recommend to use “***Setup actions***”.
{% endhint %}

* **Advanced filtering,** for applying more complex filtering (multi-filtering). Select in the panel's context menu option “***Setup actions***”. This screen has two tabs on the left side, where the first one is an Advanced filter.

![Advanced filtering in Time\&Sales table](https://blobscdn.gitbook.com/v0/b/gitbook-28427.appspot.com/o/assets%2F-LD6FsRvQ3jgwJIg6O7r%2F-LSZlUr_Myk0rKIIPYb3%2F-LS_5SP-opC1CiDG-iws%2Fadvanced%20filtering.png?alt=media\&token=e2d74d74-7ee5-4533-ae11-09d4db0ab09c)

This screen allows you to Enable/Disable filtering as well as set up filtering Conditions. These conditions are set up as:

&#x20;*IF (condition1 AND condition2 ...) OR (conditionN...) …*

You can setup as many conditions as you like. Due to the possible complex logic of filtering, you are required to apply the changes once you finished the filter set up.

If you have additional questions or proposals about this functional, feel free to contact us. We are here to help you!


# Price Statistic

**Price Statistic** is essentially a [**volume profile**](/analytics-panels/chart/volume-analysis-tools-or-volume-profiles-or-footprint-chart-or-vwap/volume-profiles) that is presented in tabular form. The panel aggregates the volume data for each price for a selected period of time. By activating the required columns, you will immediately see Trades, Volume, Delta, Average and Maximum Volumes. Filtering and notification system will show the data significant for the trader.

![General view of Price Statistic panel](https://blobscdn.gitbook.com/v0/b/gitbook-28427.appspot.com/o/assets%2F-LD6FsRvQ3jgwJIg6O7r%2F-L_I24Yxv14WDjkEeL9J%2F-L_I3DeKIuPEGmrBP-nl%2FPrice%20Statistic%20general%20view.png?alt=media\&token=fd3e5301-ae16-496e-9dab-88e1d4948e24)

## Price Statistic & Volume Profile. What's the difference? <a href="#price-statistic-and-volume-profile-whats-the-difference" id="price-statistic-and-volume-profile-whats-the-difference"></a>

As we have already said, the Price Statistic panel contains data in the form of a table that shows the volume profile. Below is an image showing how the panel is linked to the volumetric profile.

The main difference and advantage of the Price Statistic is that the table presents all available volume data for a particular price, which can be sorted or uploaded to an external csv file for further analysis.

![Price Statistic and Volume Profile](https://blobscdn.gitbook.com/v0/b/gitbook-28427.appspot.com/o/assets%2F-LD6FsRvQ3jgwJIg6O7r%2F-L_NOm0eBpyrq5Cx9om2%2F-L_NqstDgTx5MNmPDGQP%2FChart%20and%20price%20statistic.png?alt=media\&token=8d84f7aa-6695-4763-8272-879ab6f399f1)

Volume profile and data in the Price Statistic table are built for the current day. If you sort the volume column in descending order, the price in the table ($2,766) will correspond to the POC line on the volume profile.

## How to enable it? <a href="#how-to-enable-it" id="how-to-enable-it"></a>

In the main menu of the platform in the ***Analytics category***, find the Price Statistic panel and click on it to launch it.

![Launch the Price Statistic panel](https://content.gitbook.com/content/urdqk4sHwHHpr4J3s5P6/blobs/X8I3mfOVeFuRsynKi4G3/3.png)

## Available Data types in Price Statistic <a href="#availalbe-data-types-in-price-statistic" id="availalbe-data-types-in-price-statistic"></a>

Each column in the table corresponds to a specific data type that you can show / hide through the panel settings or by right-clicking on the table.

![Adding columns to the Price Statistic table](https://blobscdn.gitbook.com/v0/b/gitbook-28427.appspot.com/o/assets%2F-LD6FsRvQ3jgwJIg6O7r%2F-L_Nu19J5ilUz3Ofh_bu%2F-L_Nxx9HJONsoColTwZW%2Fadd%20columns%20to%20price%20statistic.gif?alt=media\&token=637e7c01-56ef-49d6-a852-a4f108b362da)

**Trades** — it's the number of contracts (trades) that executed at each price level.

* **Buy (or Sell) trades** — it's the number of Buy (or Sell) trades that executed at each price level.
* **Volume** — the total size of all positions that executed at each price level or price range.
* **Buy (or Sell) Volume** — the total size of all Buy (or sell) positions that executed at each price level or price range.
* **Buy (or Sell) Volume, %** — shows how many percent of the total volume relates to Buy (or Sell) trades
* **Delta and Delta %** — shows the difference in traded Volume between Buyers and Sellers. It allows evaluating who controls the price on the market at a given time. Delta % = Delta / Volume \* 100
* **Average size** — the average volume of the position that was executed at a certain price or price range.
* **Average Buy size** — the average volume of a Buy position that was executed at a specific price or price range.
* **Average Sell size** — the average volume of a Sell position that was executed at a specific price or price range.
* **Max one trade volume (value and %)** — shows the maximum volume of a single trade that has executed at a certain price or price range (depending on the Custom Step (ticks) setting).
* **Filtered volume (value and %)** — this parameter displays volumes that exceed the size specified in the filter. If the volume size is smaller than the one specified in the filter, then the values will be zero.
* **Buy (or Sell) filtered volume** — the parameter displays Buy (or Sell) volumes that exceed the size specified in the filter.


# DOM Surface

DOM Surface panel shows all past and current changes in the order book — placing, modifying orders, and executing trades.

Using the **DOM Surface** panel, a trader sees all changes of limit orders in the Order Book (depending on the depth of market data), which is presented as a Heatmap. The panel shows the placement of limit orders, their changing, canceling, or execution by large market participants, as well as the imbalance between buyers and sellers.

Unlike other types of charts, such as Footprint (or Cluster chart), the Order Flow shows not only aggressive market orders but also limit orders, which have a greater influence on the price behavior.

### **How To Interpret The DOM Surface Chart**

Price changes due to matching between limit and market orders:

* **Market Sell** order is matched with the **Buy Limit** order at the best bid price.
* **Market Buy** order is matched with the **Sell Limit** order at the best offer price.

![](https://lh6.googleusercontent.com/ft_IRf5_nmW-FyMzjx_V-a_yZv6eE1pliJwQCyCYbjLzSEcYWniWYRP1YwPUKXmKmhHdojjGFw1mQmkIjpWmNy0pY38Qe3PZ_A3iA4Ng31VH2sFRaUdCZcFb7dqFqvnQ5mc0Hs4)

**Order Book** shows the volume for Bids & Offers at different price levels, which can be presented as a DOM table or as a **Heatmap** chart.

At any given time, new orders are placed on the market and existing orders are either changed/canceled, or executed. It is very difficult to track all these changes through the DOM table, so the visual representation of this process in the form of a Heatmap is more useful.

The main advantage of **Heatmap visualization** over the classic DOM view is that you immediately see the zone of accumulation of large orders that are waiting to get filled. These high liquidity zones are a "magnet" for the price, as they often match with psychological price levels or values of popular technical indicators (*MA 200, MA 50, Daily High/Low, etc.*). Therefore, even in the short term, the price can come to these levels.

Heatmap also shows the dynamics (increase or decrease in volume) of limit orders at certain price levels. Thanks to the gradient color scheme, the trader sees the zones of high interest, which are shown in bright colors. The levels with the minimum number of orders have dull colors. This allows you to visually assess the strong support and resistance levels, as well as to understand the reasons for the rapid price changes.

### DOM Surface and Volume Analysis Tools

In addition to visualizing the flow of limit orders, there are Volume Analysis Tools, which show the distribution of trade volume, delta, and other data for a selected period of time. More information about each tool can be found in our documentation in the Analytical Panels — Chart — Volume Analysis Tools section.<br>

### General Settings

In the panel's general settings there are a number of settings that are identical in other panels, but some are specific to DOM Surface.

**DOM levels count** — shows the number of price levels in each direction from Best Bid and Best Offer.

**Maximal level2 size** — allows you to adjust the brightness of levels depending on the specified volume value. There are two modes: ***Auto, Custom***.

For example, let's set the value to 20. All levels where the volume is equal to or exceeds this value will have the brightest color. All levels with a volume less than the set value will have a less vivid coloring proportional to the volume on them.

### Additional DOM Surface columns

On the right side of the panel, there are three histograms — **Size, Cumulative Size, Order Book Imbalance**.

![](https://lh5.googleusercontent.com/Lz8F5IiifqGYgwGW7r1uBlX6ziEowJ4fwALwXsbLRlA5QVOYEmDO_0TEbWBOpMsPg-0UiccNIFJRD0IVKBjkaordyD-AE7mjOwNb73QCMo9TcifPsv4jLqC7PlhPK545GiJtj8g)

\* **Size (Current Order Book)** This histogram shows the volume of limit orders at each price level. Users can visually compare the size of each bar for determining the most strong level.

\*  **Cumulative Size** This histogram displays the sum of sizes of limit orders for each subsequent level. This histogram allows estimating the dominating side of the market.

\*  **Imbalance (Order Book Imbalance)** This histogram shows the percentage of how much the volume of buy orders exceeds the number of sell orders (and vice versa) for each price level. It measures whether the limit order book is bought or sell heavily. The more the imbalance exceeds one side, the higher the probability of price movement towards the imbalance. In fact, it is a good predictor of price direction.


# Option Analytics

Option Analytics is a professional panel for options traders that allows making strong options analysis and send orders in one click.

![General view of the Option Analytics panel](https://content.gitbook.com/content/urdqk4sHwHHpr4J3s5P6/blobs/eUkLmtZy2dAGFF9624kC/general%20view%20of%20Option%20Analytics.png)

There are 3 main controls on the main toolbar

![Main toolbar](https://blobscdn.gitbook.com/v0/b/gitbook-28427.appspot.com/o/assets%2F-LD6FsRvQ3jgwJIg6O7r%2F-L_DEdSKXLIpNHZZB9G2%2F-L_DZbIZ74WzWEHV-Yhn%2FOption%20analytics%20main%20toolbar.png?alt=media\&token=f9caf346-0bb3-4915-9e1a-e6136a5b1a38)

**Symbol Lookup** for selecting a trading instrument that has an option series

* **Level 1 bar** provides information about current Ask/Bid/Last prices, spread and day range of selected symbol
* **Panel Appearance** allows trader to go throungt three different views of panel: ***Option desk, Analyzer*** and combination of ***Desk & Analyzer*** simultaneously.

## **Options desk** <a href="#options-desk" id="options-desk"></a>

![](https://blobscdn.gitbook.com/v0/b/gitbook-28427.appspot.com/o/assets%2F-LD6FsRvQ3jgwJIg6O7r%2F-LSnVXu35IQzafDlIMiZ%2F-LSngO9GHi6I7kf8btdj%2Fimage.png?alt=media\&token=75a4ba5b-56f5-4c42-bbe9-5a5fe49d34d0)

(1) - This control allows to manage simultaneously visible options series and strikes. (2) - Right click on table's header will show a context menu where trader can select visible columns. (3) - Paper column is an interactive column that used to add a paper position to porfolio, to do it - click on column's cell and set value. (4) - Right click on a row will show a strike's context menu

![](https://blobscdn.gitbook.com/v0/b/gitbook-28427.appspot.com/o/assets%2F-LD6FsRvQ3jgwJIg6O7r%2F-LSnVXu35IQzafDlIMiZ%2F-LSnqF2d24hFAIDZQBrD%2Fimage.png?alt=media\&token=326adf80-32f8-4952-a72a-a340caaefe9b)

(5) - Double click on Ask/Bid cells will open an Order Entry panel

## **Joint mode of Option Desk & Analyzer** <a href="#joint-mode-of-option-desk-and-analyzer" id="joint-mode-of-option-desk-and-analyzer"></a>

Add Paper positions in the options desk and the strategy analyzer will immediately show the option profile. This mode will allow you to see all changes in options desk — prices, volatility, options Greek values — and option profiles on one screen.

![Option Analytics panel offers the joint mode of Options Desk and Analyzer](https://blobscdn.gitbook.com/v0/b/gitbook-28427.appspot.com/o/assets%2F-LD6FsRvQ3jgwJIg6O7r%2F-L_DEdSKXLIpNHZZB9G2%2F-L_DOrnFepUuXcQTTkMk%2Fdeskanalyzer.gif?alt=media\&token=0a005a66-11b2-4924-a168-8fa06e49083d)

Option Analytics panel offers the joint mode of Options Desk and Analyzer

## **Analyzer** <a href="#analyzer" id="analyzer"></a>

Analyzer allows users to see the profile of existing portfolio. The profile illustrates a behavior of portfolio in cases of underlying instrument price change, volatility change or time decay. Also Analyzer provides a possibility to add an overlay to main chart. It can be one of Greeks: Delta, Gamma, Vega, Theta or Rho

![](https://content.gitbook.com/content/urdqk4sHwHHpr4J3s5P6/blobs/9Jx4bdylxFZ9mXaFlT99/image.png)

(1) - This controll allows to select a chart's data type. Possible options are: P/L, Delta, Gamma, Theta, Vega, Rho (2) - This controll allows to add an overlay to main chart

![Add overlays on options profile chart](https://content.gitbook.com/content/urdqk4sHwHHpr4J3s5P6/blobs/zOBdEdID4IIC3QmqpPHb/options-overlay.gif)

(3) - By clicking on this button user can apply "What if" scenarios.

![Use What-If scenario analysis to assess the impact of volatility or time decay on the position](https://content.gitbook.com/content/urdqk4sHwHHpr4J3s5P6/blobs/4YdZKTICAwIylEvylUm8/what-if-analysis.png)

Trader is able to simulate the time decay and volatility impact scenarios simultaneously or separately by setting corresponding values. Up to 5 lines can be drawn at the same moment of time. All "What if" lines are drawn in dashed style.

## **Papers, Positions, Working orders** <a href="#papers-positions-working-orders" id="papers-positions-working-orders"></a>

The bottom part of the panel contains combined table with paper positions, real positions and working orders

![](https://content.gitbook.com/content/urdqk4sHwHHpr4J3s5P6/blobs/manq3WoFnUMRTZa5SVyO/image%20\(1\).png)

&#x20;(1) - Add underlier button allows to add a paper position of underlying symbol to the list of existing positions. (2) - Hot buttons provide a possibility to make group actions with portfolio such as: place papers, cancel papers or close real existing positions. (3) - Right click on table's header will show a context menu where trader can select visible columns. (4) - By clicking on Anayse checkboxes user can include or exclude certain positions from portfolio. (5) - Place button allows to place a paper position (6) - Remove icon allows to remove a paper position


# Trading panels
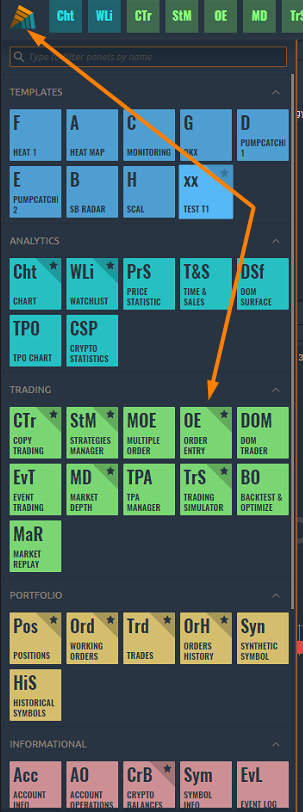
<table data-card-size="large" data-view="cards" data-full-width="true"><thead><tr><th data-type="content-ref"></th></tr></thead><tbody><tr><td></td></tr><tr><td></td></tr><tr><td></td></tr></tbody></table>


# Order Entry

Order Entry allows to create trading orders with different conditions, such as order quantity, price, side, order type and submit them on the market.

[**Order Entry for Bybit connection**](broken://pages/-Me4PBJ955TGkIeQjBzf)

### How to open the Order Entry panel?

Open the main menu by clicking the logo and in the **Trading section** click on the OE icon.

<figure><img src="https://content.gitbook.com/content/urdqk4sHwHHpr4J3s5P6/blobs/xlW132LexV7I2ozCX2P5/oe.png" alt=""><figcaption><p>Open Order Entry panle in general menu</p></figcaption></figure>

### General info

**Order Entry** panel allows to create trading orders with different conditions, such as order quantity, price, side, order type, and submit them on the market. From the Order Entry panel, you can supply all of the necessary information for order and easily submit it by clicking the appropriate action button.

<figure><img src="https://content.gitbook.com/content/urdqk4sHwHHpr4J3s5P6/blobs/nT97a2f7fNffyNNjJ9QB/oe2.gif" alt=""><figcaption></figcaption></figure>

The entire panel is conventionally divided into several zones:

* choice of trading instrument and trading account;
* setting the required order quantity and the order side (Buy or Sell);
* choice of order type, its price and TIF condition;
* setting of stop loss and take profit prices;
* information on current Ask and Bid prices, spread size, VWAP prices, as well as an order placement button.

## Symbol and account selection <a href="#symbol-and-account-selection" id="symbol-and-account-selection"></a>

The selection of a trading instrument can be performed manually through the [Symbol Lookup](/general-settings/symbols-lookup) or via linking the panel to other panels, for example, to the chart. Just select one link color in two panels and they will have a synchronized symbol parameter.

If there are several trading accounts available within your connection, you can select the required account by clicking the **Select Account** button.

![Select the required trading account](https://blobscdn.gitbook.com/v0/b/gitbook-28427.appspot.com/o/assets%2F-LD6FsRvQ3jgwJIg6O7r%2F-LGdkWCf4qSS-tsfe6MD%2F-LGdweyfS7kNR264RTu5%2Fselect%20trading%20account.png?alt=media\&token=42c9c2a7-7557-40dc-a459-fc264179928a)

## **Order types and restrictions** <a href="#order-types-and-restrictions" id="order-types-and-restrictions"></a>

Order Entry automatically lists all exchange-supported order types available for the associated instrument under the selected connection. Within our existed connections we support:

* **Market order** is an order placed without a price with the intention of hitting the best Bid or taking the best Offer currently available in the market. The order fills at the current best price.
* **Limit order** allows submitting an order at a specific limit price or better.
* **Stop order** allows submitting a buy or sell market order if and when the stop trigger price is touched.

![Order types](https://blobscdn.gitbook.com/v0/b/gitbook-28427.appspot.com/o/assets%2F-LD6FsRvQ3jgwJIg6O7r%2F-LG_r-iL2n5AH-OhOhZy%2F-LGa0Dkz8VtkTHB5BTiq%2FOrder%20types.png?alt=media\&token=136035e3-be47-431c-9da5-fc6242264f80)

**Time-in-force** (TIF) instructions define the length of time over which an order will continue working before it is canceled. Within our existed connections we support many TIFs:

* **DAY** is an order will be canceled if it is not executed within the current trading day;
* **FOK** (or Fill or Kill) - an order will be canceled if it is not executed in the entire volume as soon as it becomes available;
* **GTC** (Good till canceled) orders will remain working until they are canceled by trader or the contract expires;
* **IOC** (Immediate or cancel) requires that any portion of an order that is not filled as soon as it becomes available in the market is canceled;
* **GTD** (Good till date) order will remain working within the system and in the marketplace, until it executes or until the close of the market on the date specified.

![The list of TIF conditions](https://blobscdn.gitbook.com/v0/b/gitbook-28427.appspot.com/o/assets%2F-LD6FsRvQ3jgwJIg6O7r%2F-LG_r-iL2n5AH-OhOhZy%2F-LGa-j1dVvsObHIXfKqq%2FTIF%20types.png?alt=media\&token=e9c8cfcb-d461-452f-bfc3-4671f0b1573f)

{% hint style="info" %}
The TIF list can be different depends on connection, order type or instrument type!
{% endhint %}

## Order Protection <a href="#order-protection" id="order-protection"></a>

To protect the position from a significant loss, you can use the **Stop Loss** orders. To do this, activate the "***Stop Loss***" checkbox and specify the price at which the order will be closed.

Once the position becomes profitable, you can change the Stop Loss price to a break-even level. To automate this process, **Trailing Stop** was created. This tool is especially useful when price changes strongly in the same direction or when it is impossible to watch the market continuously for some reason.

![Activation of Trailing stop](https://blobscdn.gitbook.com/v0/b/gitbook-28427.appspot.com/o/assets%2F-LD6FsRvQ3jgwJIg6O7r%2F-LGdkWCf4qSS-tsfe6MD%2F-LGe2w7-XQrFkAm8bLmq%2Ftrailing%20stop%20order.png?alt=media\&token=5dfebab9-6c89-4902-b983-8c0a20b20be0)

To gain profit, you can use the **Take Profit** order, which will automatically close the position at the specified price. To do this, activate the "***Take Profit***" checkbox and specify the price at which the order will be closed.

{% hint style="info" %}
Stop Loss order can be set:

* for Long positions below the current price
* for Short positions above the current price

Take Profit order can be set:

* for Long positions above the current price
* for Short positions below the current price
  {% endhint %}

**Order Confirmation**

Once you have set all the necessary parameters of the order and clicked the **PLACE ORDER** button, the order confirmation screen will appear.

This window contains summary information about your order, which will allow you to verify the correctness of the entered data - order type, trade instrument, price, quantity, prices of take profit and stop loss.

![Confirmation of the order placement](https://blobscdn.gitbook.com/v0/b/gitbook-28427.appspot.com/o/assets%2F-LD6FsRvQ3jgwJIg6O7r%2F-LGdYsAVA-p-cr0bj3wS%2F-LGd_-qCRSCgPzsH12Qr%2FOrder%20confirmation.png?alt=media\&token=646dcc5f-27ab-4091-b5c2-43ca8b455f78)

![Confirmation of the order cancellation](https://blobscdn.gitbook.com/v0/b/gitbook-28427.appspot.com/o/assets%2F-LD6FsRvQ3jgwJIg6O7r%2F-LGdYsAVA-p-cr0bj3wS%2F-LGd_VsGlV_VDCCFjZfx%2FConfirmation%20of%20order%20cancel.png?alt=media\&token=b5c0c6a5-c110-47c5-9fd1-280dc1e549d2)

If you activate the "***Do not show again***" checkbox, the confirmation will not be displayed and the order will be immediately sent to the order book. In order to return these notifications, it is necessary to activate the "***Confirm order placement***" checkbox in the [General settings](broken://pages/nnskPmOU6YGv94UH57Pj) of the application


# Order entry for Bybit

How to create an order on Bybit exchange from the OE (order entry) panel and the chart trading sidebar. Differences and features of order entry panels for Bybit

Placing of orders on the Quantower platform can be done in several ways:

* using the Order Entry panel (OE)
* Quick order placement through the chart area with a mouse (visual trading)
* via [**DOM Trader panel**](/trading-panels/dom-trader)

### **How to place an order from the OE (Order Entry) panel**

* [**How to open the Order Entry panel**](#how-to-open-the-order-entry-panel)
* [**General view of the OE (Order Entry) panel for Bybit**](#general-view-of-the-oe-order-entry-panel-for-the-bybit-exchange)
* [**Order parameters — Type, Price, Quantity, TP (take profit) and SL (stop loss)**](#tp-and-sl-orders-from-the-oe-panel-order-entry)

### **How to place an order from the Chart trading sidebar**

* [**General view of Chart Trading Sidebar**](#general-view-of-the-quick-trade-panel-from-the-chart-for-bybit)
* [**Order quantity selection**](#order-volume-selection)
* [**Quick order quantity buttons**](#quick-change-order-amount-buttons)
* [B**uttons for fast change of order volume Order parameters** ](#quick-change-order-amount-buttons)**- type, TIF, price, algorithmic settings TP (take profit) and SL stop limit (stop loss) orders**

### How to open the Order Entry panel?

Open the main menu by clicking the logo and in the **Trading section** click on the OE icon.

<figure><img src="https://content.gitbook.com/content/urdqk4sHwHHpr4J3s5P6/blobs/xlW132LexV7I2ozCX2P5/oe.png" alt=""><figcaption><p>Open Order Entry panel in general menu</p></figcaption></figure>

## General view of the OE (Order Entry) panel for the Bybit exchange

<figure><img src="https://content.gitbook.com/content/urdqk4sHwHHpr4J3s5P6/blobs/wnngF4I4gEg4hsR6Y2Dq/image.png" alt=""><figcaption><p>Order Entry panel for Bybit exchange</p></figcaption></figure>

The entire panel is conventionally divided into several **zones**:

* choice of trading instrument and trading account;
* setting the required order type, TIF condition, order quantity, and the order side (Buy or Sell);
* setting of the order price, stop loss and take profit prices;
* order placing strategy for advanced trading algorithms
* information on current Ask and Bid prices, spread size, as well as an order placement button

### Selection of Order Type, Time if Force and Order Quantity

Bybit exchange provides 3 main order types: **Market, Limit, Conditional orders**.

<figure><img src="https://content.gitbook.com/content/urdqk4sHwHHpr4J3s5P6/blobs/Snqme7UuDrJhCzMRwZVk/image.png" alt=""><figcaption></figcaption></figure>

You can enter an order volume by specifying the amount in the currency of the quote and as a percentage of the available margin. There are three ways to do this, as described below:

* Enter the desired amount of coins/lots based on the selected trading pair;
* Enter the total amount of the order. This field is very useful when you need to quickly specify the amount of entry into the transaction immediately in the currency of the balance, without recalculating the number of coins on the exchange rate;&#x20;
* Select with the slider the order amount in % of the total maximum available balance taking into account the set leverage.

### TP and SL orders from the OE panel (order entry)

&#x20;Bybit exchange allows users to calculate possible risks even **before opening a transaction (!)** and users can set their goals - TP (Take Profit) and limit losses with SL order (Stop Loss), simultaneously with order entry into position. To do this, on the order entry panel at the same time as setting an order, you can immediately set the necessary parameters TP and SL

<figure><img src="https://content.gitbook.com/content/urdqk4sHwHHpr4J3s5P6/blobs/K61NrpDlM6cwzMK7XnWS/image.png" alt=""><figcaption></figcaption></figure>

### How to create a Bybit order from the quick order entry panel from the chart&#x20;

Below we will look at how to create an order on the Bybit exchange from the quick order entry panel from the chart. Before we do this, make sure that you have successfully connected to the Bybit exchange, and selected a trading pair from this connection.

You can open the Bybit chart quick order entry toolbar as shown in the figure below:

<figure><img src="https://content.gitbook.com/content/urdqk4sHwHHpr4J3s5P6/blobs/VBiFl2JPj7BDDe5jXw11/image.png" alt=""><figcaption></figcaption></figure>

### General view of the quick trade panel from the chart for Bybit

&#x20;The general view of the order entry panel for Bybit connection looks like the following and is divided into the following categories:&#x20;

* Account and symbol selection&#x20;
* Order volume selection and direction selection
* Order parameters - type, TIF, price, algorithmic settings.&#x20;
* Mode for Stop Loss and Take Profit.&#x20;
* Order placement parameters (strategy)

<figure><img src="https://content.gitbook.com/content/urdqk4sHwHHpr4J3s5P6/blobs/J11SfeMxIfL9QAffBGEO/image.png" alt=""><figcaption></figcaption></figure>

### Order volume selection&#x20;

You can select the order volume by specifying the amount in the quote currency and in percentage of the available margin. This can be done as described below, depending on your trading style and type:

* enter the desired number of coins/lots based on the selected trading pair;&#x20;
* Using the quick change order amount buttons;&#x20;
* enter the total amount of the order. This field is extremely convenient when you need to quickly specify the amount of entry into the transaction immediately in the currency of the balance, without recalculating the number of coins on the exchange rate at the same time;&#x20;
* select with the slider the order amount in % of the total maximum available balance taking into account the set leverage.

<figure><img src="https://content.gitbook.com/content/urdqk4sHwHHpr4J3s5P6/blobs/OqEbpc4P8toZAamA5SNU/image.png" alt=""><figcaption></figcaption></figure>

### Quick change order amount buttons&#x20;

The quick change order amount buttons will help you change the specified volume in one click, based on your trading strategy. You can set by default any parameters that you need to quickly change the values. Moreover, the buttons can change not only the specified position volume, but also apply any (!!!) formulas to calculate the order volume. To set your personal values for a quick change of the order, you need to go to the settings of the chart in the menu section "Order entry" and find the field "OE buttons"

<figure><img src="https://content.gitbook.com/content/urdqk4sHwHHpr4J3s5P6/blobs/KnAfSo20QZBt1iYJQI4X/image.png" alt=""><figcaption></figcaption></figure>

You can set standard values of the order amount, which corresponds to your risks. This is very convenient for manual trading.

{% hint style="success" %}
Buttons can change not only to a given amount of position, but also apply any formulas
{% endhint %}

<figure><img src="https://content.gitbook.com/content/urdqk4sHwHHpr4J3s5P6/blobs/W0iDpEImgDyBDyCMQMAB/bybit111.gif" alt=""><figcaption></figcaption></figure>

### Order parameters - type, TIF, price, algorithmic settings

Time-in-Force (TIF) parameters determine the length of time an order will continue to run before it is canceled. Bybit provides a variety of TIFs:

<figure><img src="https://content.gitbook.com/content/urdqk4sHwHHpr4J3s5P6/blobs/ZLn7IBefYng6V8uvYoPV/image.png" alt=""><figcaption></figcaption></figure>

* GTC (Good Until Cancelled) - Orders will work until they are cancelled by the trader or the contract expires;&#x20;
* FOK (or Fill or Kill) - the order will be canceled if it is not executed in full as soon as it becomes available; I
* OC (Immediately or Cancel) - requires that any part of the order that has not been executed as soon as it becomes available in the market will be canceled;

### Post-Only

&#x20;When the "Post-Only" option is checked, the order is not executed as a Taker operation, and therefore a Maker's fee is earned when the order is executed. The order "Post-Only" is automatically cancelled if it can be executed immediately against an existing order in the market.

### Reduce-Only&#x20;

Used to reduce the size of a position and does not increase its size.&#x20;

### TP (Take Profit) and SL Stop Limit (Stop Loss) orders&#x20;

Bybit allows users to calculate potential risks before opening a position (!) and users can set their objectives as TP (Take Profit) and SL (Stop Loss) orders, simultaneously with an order to enter the position. To do this, on the order entry panel at the same time as setting an order, you can immediately set the necessary parameters **TP and SL**

<figure><img src="https://content.gitbook.com/content/urdqk4sHwHHpr4J3s5P6/blobs/MQWs5r3cPWTecb7QmXRn/image.png" alt=""><figcaption></figcaption></figure>

{% hint style="success" %}
After placing the position, TP and SL can be changed according to the situation directly from the chart by moving the mouse to new levels:
{% endhint %}

<figure><img src="https://content.gitbook.com/content/urdqk4sHwHHpr4J3s5P6/blobs/gZW7mr7bRCyHY8n9V298/%D1%81%D1%82%D0%BE%D0%BF%20%D0%B8%20%D1%82%D0%B5%D0%B9%D0%BA%20%D0%B1%D0%B0%D0%B9%D0%B1%D0%B8%D1%82.gif" alt=""><figcaption></figcaption></figure>

Next comes a large **block of functions for managing the current position**. You can delete or limit orders or stops. You can also reverse your position with a single button or set a lossless position. These are very functional buttons, do not miss them.&#x20;

More detailed settings with trading examples and additional conditions in the ByBit exchange's own "order execution " section


# Order Types

Order Types allow you to specify how an order behaves when it enters the market. For example, you may want an order to immediately fill at the current best price (market order) or to fill only at a particular price (limit order).

Order Types differ from order restrictions which set how the order behaves during the session. For example, an order may delete if not filled by the end of the session (Day) or may exist until filled or canceled (GTC).

| Connection      | Order Types                                                      | Brackets (SL/TP)                                     | OCO           | Additional                  |
| --------------- | ---------------------------------------------------------------- | ---------------------------------------------------- | ------------- | --------------------------- |
| Binance (Spot)  | Market, Limit,                                                   | Not available                                        | Not available |                             |
| Binance Futures | <p>Market, Limit, <br>Stop market, Stop Limit, Trailing Stop</p> | <p>Server-side</p><p>(only for existed position)</p> | Not available | Behaviour (Open or Close)\* |
| Bybit           |                                                                  |                                                      |               |                             |

Orders can be divided into 2 groups by side:

* **Buy** order which opens a long position is sent if the trader believes in the further growth of the asset;
* **Sell** order which opens a short position is sent if the trader believes in the further decrease of the asset.

![Order's side - Buy and Sell](https://blobscdn.gitbook.com/v0/b/gitbook-28427.appspot.com/o/assets%2F-LD6FsRvQ3jgwJIg6O7r%2F-LGeaZLt3y-JDUqddAzn%2F-LGeabG9WHXAoQpwzifV%2Forder%20side.png?alt=media\&token=6e472deb-e59b-4827-a56d-2ba3152465ef)

Depending on a trading connection 3rd Dimension supports the following order types:

* **Market** **order** is an order placed without a price with the intention of hitting the best Bid or taking the best Offer currently available in the market. The order fills at the current best price.

  Note, that Market orders may partially fill at multiple price levels.<br>
* **Limit order** allows you to submit an order at a specific (desired) limit price. Like market orders, limit orders allow for partial fills however, the remaining quantity continues to work in the market at the original limit price.
* Stop order.


# Order placing strategies

Placing orders with some automation

Each time you place an order in 3rd Dimension — you do it immediately by pressing a corresponding button and sending your order to the remote server. This is a usual operation for every trader, but what if you would like to schedule the order sending or split the order's quantity in time. Maybe you would like to apply some non-standard order parameters or order types not supported by your exchange?

## Where and how to use it?

Here comes the functionality of Order placing strategies, allowing simple automation of complex order submission. You can find the corresponding control in every Order entry panel or sidebar.
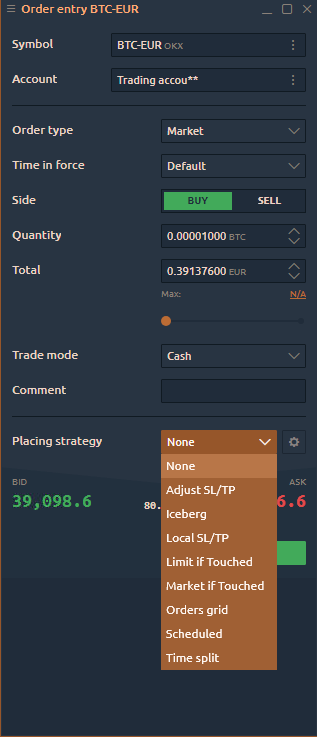
<figure><img src="https://content.gitbook.com/content/urdqk4sHwHHpr4J3s5P6/blobs/jFRuxTHLfMjOUSSIWvxp/Screenshot_2.png" alt=""><figcaption><p>Order placing strategy control in 3rd Dimension Order entry</p></figcaption></figure>

To apply some Order placing strategy, you should:

1. select the required type of automation from the dropdown list;
2. set up automation parameters;
3. press a <mark style="background-color:blue;">send</mark> button , and your automation will start immediately after that.

### Types of placing strategies

There are several placing strategies currently available for use, and this list is constantly growing, so let's find out how to set up and use them for your trading:

* **Iceberg**
* **Local SL/TP**\
  Allows Stop loss and Take profit orders for brokers that don't support them natively. [<mark style="color:blue;">**Read more about this type of automation**</mark>](broken://pages/yElZhI0sS7vFcniXIpgu)
* **Limit if Touched**
* **Market if Touched**
* **Scheduled**\
  Specify the exact time in the future, when your platform should send this order.
* **Time split**\
  Send one order by several parts in some time interval.

### Order placing strategies panel

You can find all of the active and finished Placing strategies in the corresponding panel, which you may launch from the 3rd Dimension start menu. This panel contains the list of created Strategies and a logs section. You can click on any Strategy and see how it works and what actions it performs. Here you can also stop any active strategy or clear the finished ones.

<figure><img src="https://content.gitbook.com/content/urdqk4sHwHHpr4J3s5P6/blobs/cF5ejDSIfSeUZ0EfWpir/image.png" alt=""><figcaption><p>Order placing strategies panel</p></figcaption></figure>

## Please pay attention!

{% hint style="warning" %} <mark style="color:orange;">All automation of Placing strategies</mark> <mark style="color:orange;"></mark><mark style="color:orange;">**works while the platform is functioning**</mark><mark style="color:orange;">. When you close your platform, it will delete all automation without the possibility to restore it</mark>
{% endhint %}


# Local SL/TP

Local Stop loss & Take profit orders allow to set these types of orders for all connections that don't natively support them

## Before the use in live trading

3rd Dimension provides this functionality using the Orders placing strategy feature, meaning that all of the Local orders are solely handled on the platform side (literally "on your machine"). Such behavior leads to some important notices and limitations that users should understand before use of Local closing orders:

{% hint style="warning" %} <mark style="color:orange;">**We insist that you read, practice, and understand how the Local closing orders work before using them for live trading.**</mark>&#x20;
{% endhint %}

{% hint style="info" %}
**Local SL/TP orders exist and managed on the platform side ("on your machine").**&#x20;
{% endhint %}

{% hint style="danger" %}
**When you close the platform, it will permanently&#x20;**<mark style="color:red;">**delete ALL Local SL/TP orders**</mark>**.**&#x20;
{% endhint %}

{% hint style="danger" %}
**When your platform loses connection, it will permanently&#x20;**<mark style="color:red;">**delete all Local SL/TP orders related to this connection**</mark>**, and you won't be able to restore them after reconnecting.**
{% endhint %}

{% hint style="warning" %}
**Please, do not use&#x20;**<mark style="color:blue;">**Reverse**</mark>**&#x20;and&#x20;**<mark style="color:blue;">**Breakeven**</mark>**&#x20;buttons with orders and positions containing Local SL/TP orders to avoid unexpected behavior.**
{% endhint %}

## How to use Local SL/TP?

To add a local Stop loss and Take profit orders, you should find the Placing automation control in any Order entry (separate panel or in the sidebars) and choose the "Local SL/TP" option. During the first selection, the platform will notify you about the possibility to read the documentation on this feature and agree to the risks to trading that may occur.

<figure><img src="https://content.gitbook.com/content/urdqk4sHwHHpr4J3s5P6/blobs/VpXszEX0cn3qr9KAiqLO/image.png" alt=""><figcaption><p>Select Local SL/TP strategy from the drop-down menu</p></figcaption></figure>

Next, you should open the Local SL/TP settings and set them up as you require.&#x20;

<figure><img src="https://content.gitbook.com/content/urdqk4sHwHHpr4J3s5P6/blobs/vwALsr1bdhB6kEWrd4py/image.png" alt=""><figcaption><p>Open the Local SL/TP settings</p></figcaption></figure>

Here you will find the following parameters:

<figure><img src="https://content.gitbook.com/content/urdqk4sHwHHpr4J3s5P6/blobs/8roXGgKFaLax1qrMU0ml/image.png" alt=""><figcaption></figcaption></figure>

* **Orders price specification** (relative to parent price). \
  Offset in Ticks, Percentage & Absolute price value. It will specify in what values should the closing orders price be set.
* **Type of closing orders.**\
  What orders should send as closing. Stop or Limit (useful for some crypto exchanges, to reduce commissions)
* **Orders placement modes.**\
  Simple SL/TP or Multiple brackets (up to 3 tiers). Various schemes of placement.
* **Closing quantity.**\
  Option for the Simple SL/TP scheme, specifying how the active Local SL/TP should behave when the related parent order/position changes its quantity. With the **Whole position** option, the strategy will try to modify the closing orders. With the **Initial** choice, the strategy will not modify local closing orders quantity.
* **is trailing.**\
  An option to make Simple SL or TP trailing (changing while the price moves)
* **Tier 1, 2, 3.**\
  The closing levels for brackets scheme. You should activate the level and set its closing parameters.

Once you have finished setting up your Local SL/TP, just close the settings screen and place your order as usual. In case of any incorrect parameters, the platform will inform you in deal tickets of message screens.

<figure><img src="https://content.gitbook.com/content/urdqk4sHwHHpr4J3s5P6/blobs/kJTf50uMBPhT7X4Jmese/image.png" alt=""><figcaption></figcaption></figure>

Local orders are also parent-related, meaning that each time you create an order or position with Local SL/TP, they will be connected as "parent and child." The platform will monitor the parent order/position state and automatically close its Local "Childs" on close or cancel, so you don't need to do this manually.

### Where to monitor placing strategies?

You can track your active strategies for Local SL/TP in the [Order placing strategies panel](/trading-panels/order-entry/order-placing-strategies#order-placing-strategies-panel). There you will find the strategy status and detailed logs about its operation.

There is a possibility to see and manage Local orders in any 3rd Dimension panel as usual server-side orders. You will see a specific "Local" label placed alongside each local order in the Working orders, Chart, DOM trader, and other panels.

<figure><img src="https://content.gitbook.com/content/urdqk4sHwHHpr4J3s5P6/blobs/2AJfr3XtyLbOEtEeSc51/image.png" alt=""><figcaption></figcaption></figure>

### Mixing with broker's native SL/TP

While the trader can use the functionality of the Local orders with connections that support SL/TP orders natively, <mark style="color:orange;">**we strongly recommend avoiding mixing them**</mark>. The platform will show a warning message each time you try to use both simultaneously.


# DOM Trader

DOM Trader panel shows the number of buy and sell orders placed at various price levels around the current price for a particular instrument

## General info about DOM Trader

**The Depth of Market** or **DOM Trader** panel shows the number of Buy and Sell orders placed at various price levels around the current price for a particular instrument (most often for futures). The more the number of orders is at a certain price level, the higher the interest in this level. The trading functionality of the panel allows you to quickly and efficiently place the required number of orders at the selected price, and also drag-and-drop, change or cancel them.

![General view of DOM Trader panel](https://content.gitbook.com/content/urdqk4sHwHHpr4J3s5P6/blobs/gggT09us3JfbU0CiunpD/DOM%20Trader%20general%20view.png)

## Trading with DOM Trader <a href="#trading-with-dom-trader" id="trading-with-dom-trader"></a>

DOM Trader allows to send trading orders in two ways — **Mouse Trading mode** and **Order Entry**

To place an order via Mouse Trading mode:

* Select an account and order restriction (TIF) in the order entry;
* Enter an order quantity;
* Left-click at a specific prices in the left column will place a Buy Limit order (below the current market price);
* Left-click at a specific prices in the right column will place a Sell Limit order (above the current market price). If you place the order below the current price it will be executed by market price;
* To place a Stop order is necessary to press and hold down the ***Shift*** key and click at a required price.

![Mouse trading mode in DOM Trading](https://content.gitbook.com/content/urdqk4sHwHHpr4J3s5P6/blobs/v5Zlnmr4iIbs5jXNwCTG/DOM%20mouse%20trading.gif)

To place an order via Order Entry:

* Select an account and order restriction (TIF) in the order entry;
* Enter an order quantity;
* Click on the Bid, Ask or Market button to place your order;
* Confirm your placement by first checking all the parameters.

![Creating a new position via Order entry mode in DOM Trading](https://content.gitbook.com/content/urdqk4sHwHHpr4J3s5P6/blobs/X1HY2Cfn2jDNdkxgb3KF/DOM%20Order%20entry.gif)

## DOM Trader settings <a href="#dom-trader-settings" id="dom-trader-settings"></a>

Additional settings of the DOM Trader allow you to customize general view for convenient display of data and the panel in general.

### View settings <a href="#view-settings" id="view-settings"></a>

![General settings of DOM Trader](https://content.gitbook.com/content/urdqk4sHwHHpr4J3s5P6/blobs/gkxpqzA0wCzzTuq48hwe/DOM%20settings.png)

* **Show high/low.** Display High / Low data on the price ladder;
* **Show last trade indicator.** Graphic element in the form of a triangle on the price ladder, which shows at what price was the last trade;
* **Antagonistic size bars.** A mode that allows you to place Ask and Bid volume on one or different sides of the Size column;
* **Full-size cells.** Color scheme for Size column;
* **Show order entry.** This option shows/hides an Order Entry on the panel for quick order placement;
* **Collapse spread.** Hide or show the spread between the current Bid / Ask prices on the price ladder;
* **Show day map.** Display the upper horizontal scale, which shows the current price position relative to the High and Low of the day;
* **Show toolbar.** This option shows/hides the top toolbar with the trading symbol and expands the "useful" area of the panel. It is recommended to use this option with the symbol link.
* **Show Level 1 bar.** Shows/hides the header pane, which contains Level 1 market data for the selected instrument.

### Position Bar settings <a href="#position-bar-settings" id="position-bar-settings"></a>

At the bottom of the DOM Trader is the Position Bar, which displays a brief info about an open position on the current trading instrument — the number of contracts, the average open price, current profit and loss.

![Position Bar in DOM trading
](https://content.gitbook.com/content/urdqk4sHwHHpr4J3s5P6/blobs/kC1CuuTKZIWq3p1dXqBl/DOM%20position%20bar1.png)

![Settings of position bar in DOM Trader panel](https://content.gitbook.com/content/urdqk4sHwHHpr4J3s5P6/blobs/iR1DJWvTMHXs1YAfyiUn/DOM%20position%20bar.png)

### Hotkeys

The quick change order amount buttons will help you to change the specified amount in one click, based on your trading strategy. **It is starts from 1 to 9 numbers on keyboard.** You can set by default any parameters you need for quick change of values. And the buttons can change not only the specified position volume, but also apply any (!!!) formulas to calculate the order volume. To set personal values for a quick change of the order, you need to go to the settings of the chart in the menu section "Order entry" and find the field "OE buttons."&#x20;

<figure><img src="https://content.gitbook.com/content/urdqk4sHwHHpr4J3s5P6/blobs/jgFoCZu6PUNb4suzFss2/image.png" alt=""><figcaption></figcaption></figure>

## DOM Trader Columns

### Liquidity changes column (known as Pulling and Stacking)

Pulling and Stacking describe the summary of the Liquidity Order Book (LOB) for Bid and Ask Side separately. Stacking shows an increasing Volume in the Order Book for the Sell-Side (Ask) or Buy-Side (Bid) and reflects therefore a supportive intention for the price to move in the corresponding direction. Whereas the Pulling shows a decrease in the Volume in the Order Book and therefore a lack of interest.

### **Number of changes**

It shows how many times the values have changed at a particular price level (Bids x Asks) since the panel launched.

### **Cumulative changes**

It shows the total volume that changed at a specific price level since the panel launched.

#### *Why Number of Changes and Cumulative changes are important?*

The liquidity in the Depth of market is constantly changing due to very different types of reasons. The fast changes occurring simultaneously on the bid and ask sides are very difficult to track with the naked eye. It becomes even worse when you have over 10 levels.

This is the part where the number of changes and cumulative changes comes on handy. For a buy trade, you would expect to see an increasing number of changes combined to higher cumulative changes showing increasingly adding liquidity at a higher pace. Even better, would it be combined to a higher cumulative change on the ask side to the downside, showing participants eager pulling out the liquidity.


# DOM Trader Columns

You can choose which columns to display in the DOM Trader panel by activating them through the Settings of the panel or through the context menu (right-click).

<details>

<summary><mark style="background-color:blue;">Available Columns</mark></summary>

**Price**

**Bids/Asks**

<mark style="color:orange;">**Bids**</mark> *<mark style="color:orange;">(optional)</mark>*

<mark style="color:orange;">**Asks**</mark> <mark style="color:orange;"></mark>*<mark style="color:orange;">(optional)</mark>*

**Buy/Sell**

<mark style="color:orange;">**Buy**</mark> <mark style="color:orange;"></mark>*<mark style="color:orange;">(optional)</mark>*

<mark style="color:orange;">**Sell**</mark> <mark style="color:orange;"></mark>*<mark style="color:orange;">(optional)</mark>*

**Liquidity changes**

**Number of changes**

**Cumulative changes**

**Comments**

**Last Trade Size**

**Bid Trade Size**

**Ask trade Size**

**Cumulative Size**

**Imbalance**

**Profit & Loss**

**Profiles**
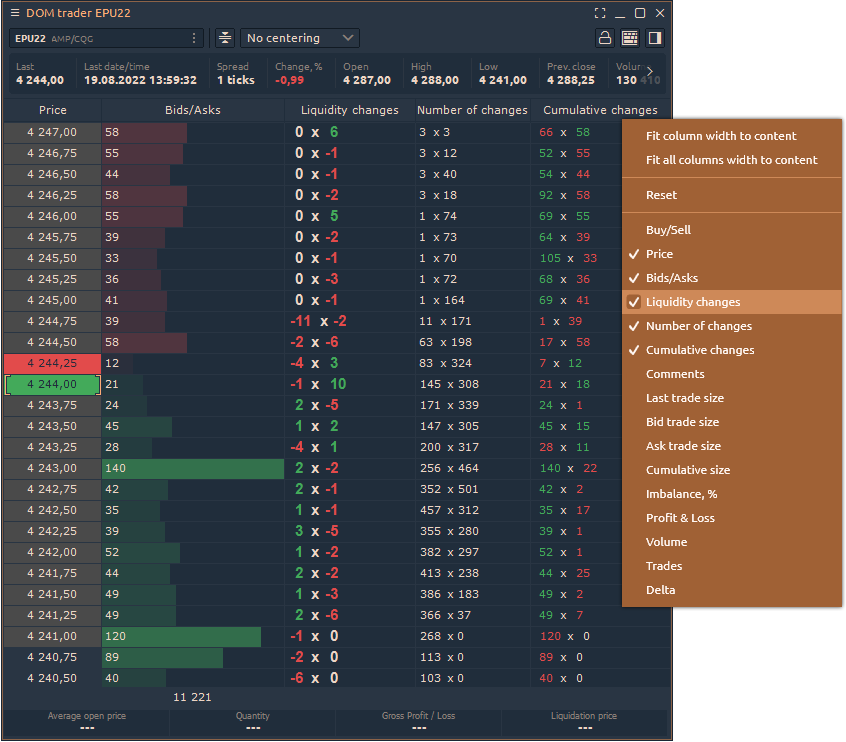
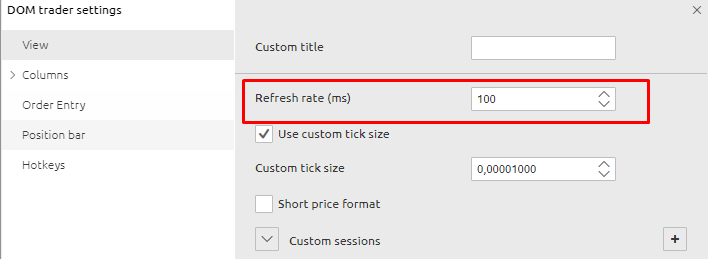
</details>

### Liquidity changes column (known as Pulling and Stacking)

Pulling and Stacking describe the summary of the Liquidity Order Book (LOB) for Bid and Ask Side separately. Stacking shows an increasing Volume in the Order Book for the Sell-Side (Ask) or Buy-Side (Bid) and reflects therefore a supportive intention for the price to move in the corresponding direction. Whereas the Pulling shows a decrease in the Volume in the Order Book and therefore a lack of interest.

<figure><img src="https://content.gitbook.com/content/urdqk4sHwHHpr4J3s5P6/blobs/08B2e1GfygWsSk6vKmcY/image.png" alt=""><figcaption></figcaption></figure>

### **Number of changes**

It shows how many times the values have changed at a particular price level (Bids x Asks) since the panel launched.

### **Cumulative changes**

It shows the total volume that changed at a specific price level since the panel launched.

#### *Why Number of Changes and Cumulative changes are important?*

The liquidity in the Depth of market is constantly changing due to very different types of reasons. The fast changes occurring simultaneously on the bid and ask sides are very difficult to track with the naked eye. It becomes even worse when you have over 10 levels.

This is the part where the number of changes and cumulative changes comes on handy. For a buy trade, you would expect to see an increasing number of changes combined with higher cumulative changes showing increasingly adding liquidity at a higher pace. Even better, would it be combined with a higher cumulative change on the ask side to the downside, showing participants eager pulling out the liquidity.

### **Cumulative Size**&#x20;

It shows the sum of Limit order volumes for each subsequent level. This histogram allows estimating the dominating side of the market.

### **Imbalance**&#x20;

It shows how many percents of buyers are more than sellers (and vice versa) for each price level.


# How to set up Dom for scalping

In this article we will look at the basic doom settings for scalping

### Refresh rate of the Dom Trader

<figure><img src="https://content.gitbook.com/content/urdqk4sHwHHpr4J3s5P6/blobs/xMJhqlgEXCiR6xruWUFc/image.png" alt=""><figcaption></figcaption></figure>

This setting affects how often the **data will be updated** in the Dom reader/ You need to experiment and find the optimal setting for your region.

{% hint style="warning" %}
Too frequent updates of Dom Trader can lead to significant delays in data processing if you have a weak computer
{% endhint %}

### How to make more visible DOM levels

<figure><img src="https://content.gitbook.com/content/urdqk4sHwHHpr4J3s5P6/blobs/n7yYRJFAGuT3JM7qnuLE/image.png" alt=""><figcaption></figcaption></figure>

To begin with, set the **number of levels** to 100. You can set any value you want.

<figure><img src="https://content.gitbook.com/content/urdqk4sHwHHpr4J3s5P6/blobs/R0AYOhdg0HXXJyHwPc2A/image.png" alt=""><figcaption></figcaption></figure>

Change the font and font size in the general view settings

<figure><img src="https://content.gitbook.com/content/urdqk4sHwHHpr4J3s5P6/blobs/FhsZRZaaaHkmTkXbrrFY/image.png" alt=""><figcaption></figcaption></figure>

Next step is the set up Price Column font to arial 12 size.

<figure><img src="https://content.gitbook.com/content/urdqk4sHwHHpr4J3s5P6/blobs/8vKt6VcU3bcBUlpjJhYG/image.png" alt=""><figcaption></figcaption></figure>

Set up font arial and size of it 12 for Bid and Ask column

<figure><img src="https://content.gitbook.com/content/urdqk4sHwHHpr4J3s5P6/blobs/ZOzimpAVe0xTdi9b7z8w/image.png" alt=""><figcaption></figcaption></figure>

Now your Dom Trader should look like on the picture. **Stretch the height** of your Dom trader to the whole monitor and you will see all available information

### How to set bid ask in one column

<figure><img src="https://content.gitbook.com/content/urdqk4sHwHHpr4J3s5P6/blobs/yNLsmqbo6xbf2AQAAKHj/image.png" alt=""><figcaption></figcaption></figure>

To set bid and ask over each other use split size colums setting. **Close Panel DOM trader settings!**

<figure><img src="https://content.gitbook.com/content/urdqk4sHwHHpr4J3s5P6/blobs/3xSvBTfAA6PL6LFxKYsd/image.png" alt=""><figcaption></figcaption></figure>

{% hint style="danger" %}
Note that after applying this setting, you must close the PANEL with settings and reopen it. You will see a new BID/ASK column - this will be the general settings for this column. You may have to edit these again to improve the readability of the DOM TRader
{% endhint %}

### How to highlight large volumes in Dom trader

<figure><img src="https://content.gitbook.com/content/urdqk4sHwHHpr4J3s5P6/blobs/p1cEZbA27qJgzfUcZvy2/image.png" alt=""><figcaption></figcaption></figure>

The essence of scalping is to see **large orders in the stack** and act in the context of the market situation. Let's take a look at how I set up the Dom. And so for that let's go to the column settings and select Bids and Asks. At first I remove the gradient setting it is a little uncomfortable for my eyes.  I want to see contrasting volumes. Observe the Dom and choose really **big volumes** and specify that value in the settings

### How to set coins quantity

<figure><img src="https://content.gitbook.com/content/urdqk4sHwHHpr4J3s5P6/blobs/UwFSOFGL0JHUg0KcbAmI/image.png" alt=""><figcaption></figcaption></figure>

Next, I specify my **standard volumes** for the trade. According to my money management I take the following shoulders 1, 2, 5,10, 20. It is very convenient to quickly change volume based on market situation.

<figure><img src="https://content.gitbook.com/content/urdqk4sHwHHpr4J3s5P6/blobs/zNrpPBsSPMuB8GyJwRDI/image.png" alt=""><figcaption></figcaption></figure>

For **instant order management** I use quick response panel and hotkeys/ I learned some hotkeys and use keyboard to trade. For example, I quickly close a position or flip a position from buying to selling.


# FX Cell

## What is FX Cell <a href="#what-is-fx-cell" id="what-is-fx-cell"></a>

FX cell panel provides the combination of two important features - quote data and trading controls for order placement. It was designed with FX traders in mind but it can be used with any symbols for any market.

![](https://blobscdn.gitbook.com/v0/b/gitbook-28427.appspot.com/o/assets%2F-LD6FsRvQ3jgwJIg6O7r%2F-LMaoiyrz-EhmHcks0Pu%2F-LMauwlC-b0EbSafcsuH%2Ffx%20cell%20general%20view.png?alt=media\&token=2910aa9c-65d1-4bcb-826d-e04d77128f6f)

The FX Cell panel menu contains:

* **Edit** — allows you to change the account or trading symbol;
* **Link** — allows linking several panels by common symbol using the Color definition. Just select one link color in FX Cell and other panel and they will have a synchronized symbol parameter. Once linkage is applied, the panel’s title will be colored to the respective color.
* **Duplicate panel** — allows you to create a copy of the panel with the same settings.

## Trading with FX Cell <a href="#trading-with-fx-cell" id="trading-with-fx-cell"></a>

* **Select a trading instrument and an account.** You can select a trading symbol manually or through linking to a [Watchlist](/analytics-panels/watchlist) or to other panels.

![](https://blobscdn.gitbook.com/v0/b/gitbook-28427.appspot.com/o/assets%2F-LD6FsRvQ3jgwJIg6O7r%2F-LMaoiyrz-EhmHcks0Pu%2F-LMb14cIwfYRjhkDCYu3%2FFX%20cell%20select%20the%20symbol.png?alt=media\&token=57eb0856-dc18-47f5-b68f-e8de544ec50e)

* **Set the order size.** Click the size field and either type a new value or use the mouse wheel to move to a new value.
* **Set the order duration (TIF).** Depending on the selected connection, the TIF types may vary.
* **Place the order**. Orders are placed by clicking the buy or sell buttons. You must confirm the order before it is placed.

You can manage your open positions with the [Position panel](/portfolio-panels/positions).


# History Player

## What is History Player <a href="#what-is-history-player" id="what-is-history-player"></a>

Testing of trading strategies is one of the most important and necessary steps for successful trading. If you are an experienced algotrader, then the automatic testing method is ideal and you can use our Extension for Visual Studio. But unfortunately, many traders don't know the programming language, which makes testing their strategies difficult.

![Launch History Player](https://content.gitbook.com/content/urdqk4sHwHHpr4J3s5P6/blobs/0ifzqsPrYOcgyx73gJti/223322%20\(1\).png)

Therefore 3rd Dimension provides the **History Player panel** for simple manual backtesting of any trading strategy.

![General view of History Player panel](https://content.gitbook.com/content/urdqk4sHwHHpr4J3s5P6/blobs/NbiOqXWiWDVrrBnETb4l/History%20player%20general.png)

History Player allows you to test on any trading instruments with any vendor or broker. This is especially useful when you have access to the data feed that does not allow execution of orders (quotation date feeds like IQFeed or crypto exchange).

How to backtest a trading strategy with History Player

## First launch of the History Player <a href="#first-launch-of-the-history-player" id="first-launch-of-the-history-player"></a>

* Start the panel from the main application menu
* Add a trading instrument for testing
* Set the data type — Tick, 1 minute, 1 day
* Set the execution type — Last or Bid/Ask/Last
* Click on the "Start" button to start testing

{% hint style="warning" %}
If you click on the "**Stop"** button, all test progress will be canceled.
{% endhint %}

&#x20;When the testing is started you can open all the necessary panels for testing by clicking on the “Open panel” button.

![Open necessary panels to create a workspace for backtesting](https://content.gitbook.com/content/urdqk4sHwHHpr4J3s5P6/blobs/GQ27krY7E6eYx97a8vCf/available%20panels%20in%20History%20Player.png)

In our blog, we showed in detail the process of [manual backtesting of trading strategies using the History Player](http://thirddimension.exchange/index.php/blog/).

## General and instruments settings <a href="#general-and-instruments-settings" id="general-and-instruments-settings"></a>

Before you start testing the strategy, you need to set up an initial trading balance, a simulation (or modeling) scheme for downloaded data, a commission size for a trading instrument, and the netting type.

![Set up the initial trading balance and modeling scheme](https://content.gitbook.com/content/urdqk4sHwHHpr4J3s5P6/blobs/wykI4LVgi3dhDKEPm8T7/Screenshot_18.png)

Strategy testing can be performed by one of three schemes to choose from:

* **OHLC** - in this mode the sequence is constructed only by the OHLC prices of the minute bars, the number of the generated control points is significantly reduced - hence, so is the testing time.
* **Open** - in this mode, all trades are opened at the opening price of the next bar. This mode is well suited for testing strategies, which process deals only at the opening of the bar and do not use pending orders, as well as StopLoss and TakeProfit orders.
* **Close** - in this mode, all trades are opened at the closing price of the current bar.

{% hint style="info" %}
"Open" and “Close” modes have the fastest testing time, but they are not suitable for all of the trading strategies. Select the desired test mode based on the characteristics of the trading system.
{% endhint %}

Now let's look at the main settings of the selected trading instrument

![Basic settings for trading instrument - Netting type and additional fees](https://content.gitbook.com/content/urdqk4sHwHHpr4J3s5P6/blobs/rdZqCNbtDSTyL9HfJWyW/Screenshot_20.png)

In the **Netting type** section, you can choose the method by which to summarize existing and new positions:

* **One position** - it is possible to open one position for one instrument in one direction in this mode. If you previously opened a position to buy 1 lot, adding a position to sell 1 lot will close the previous position. New trades for buy will be summed by volume, and the entry price will be averaged.

![Positions are overlapped by the netting type called "One Position"](https://content.gitbook.com/content/urdqk4sHwHHpr4J3s5P6/blobs/bZxylpSoFEXVYYnFQxFg/orders-matching-mode-one-position.gif)

**Multiple per Side** - this mode allows you to open many different positions in one direction. For example, opening several positions in the sequence, they will be opened separately. Opposite trades (for sale) will close them.

![Positions are overlapped by the netting type called "Multiple Per Side"](https://content.gitbook.com/content/urdqk4sHwHHpr4J3s5P6/blobs/0Ia2CrPffk7mo2ZlgchD/orders-matching-mode-multiple-per-side.gif)

**Multiple Positions** - each new trade will be opened as a separate item, including the opposite trades.

![Positions are overlapped by the netting type called "Multiple Position"](https://content.gitbook.com/content/urdqk4sHwHHpr4J3s5P6/blobs/Tt04miQNUArV4zYEJwwk/orders-matching-mode-multiple-positions.gif)


# Trading simulator

## What is Trading Simulator? <a href="#what-is-trading-simulator" id="what-is-trading-simulator"></a>

Trading Simulator is a specially designed trading tool that allows emulating the execution of orders for any connection, including those that do not allow trading.

For whom it will be useful? For any trader - from beginner to pros, trading in with any type of instrument. For example, crypto traders who do not have real accounts on a crypto exchange can trade in the demo mode on the selected crypto exchange.

![General view of Trading Simulator panel](https://blobscdn.gitbook.com/v0/b/gitbook-28427.appspot.com/o/assets%2F-LD6FsRvQ3jgwJIg6O7r%2F-LNAsSAjltjLpnHX8eOk%2F-LNAvOt4pU7_TGEZAxsY%2FTrading%20Simulator.png?alt=media\&token=1a0f489f-7dc0-43ec-8419-6c61da5a9b60)

## How to start trading simulation? <a href="#how-to-start-trading-simulation" id="how-to-start-trading-simulation"></a>

* Launch the **Trading Simulator** from the Control Center. The panel is located in the *Trading* category.
* Add desired symbols on which the trading simulation will take place.
* Set the initial balance for trading accounts, execution delay, type of netting for selected symbols, and commission size.
* Run the simulation by clicking the "**Start**" button. The status of the panel changes to ***Simulation is active.***
* Open required panels for analysis and trading. On the header of each panel which participates in the trading simulation, shows the corresponding inscription — **Simulator**.

![You can open panels that linked to the simulation process](https://blobscdn.gitbook.com/v0/b/gitbook-28427.appspot.com/o/assets%2F-LD6FsRvQ3jgwJIg6O7r%2F-LNFG3YuXDwyN3Nj6V9z%2F-LNFG7qb8ZXbcNSaMPeT%2Fselect%20the%20panel%20from%20trading%20simulator.png?alt=media\&token=8d21f5a6-4ffc-46eb-8c76-d186e4e5222a)

"**Stop**" button will abort the simulation process as well as cancel all positions and orders.

## General settings <a href="#general-settings" id="general-settings"></a>

In the general settings, you can set the initial balance for the test account, set the delay in execution, and configure the settings of netting for each instrument.

![General settings for accounts and symbols](https://blobscdn.gitbook.com/v0/b/gitbook-28427.appspot.com/o/assets%2F-LD6FsRvQ3jgwJIg6O7r%2F-LNEpO7sYUscptJoyiqt%2F-LNEr8QR-4RmZb_WqWoa%2Fsettings%20for%20trading%20simulator.png?alt=media\&token=d48d2a91-2735-44df-b7d9-2c0b78c5169a)

**Initial balance** — the amount of money for the test account.

Trading Simulator creates separate trading accounts for each base currency of the instrument. For example, if you chose EUR / USD currency pair, then the account name will be **Account (USD)**, if you select EUR / JPY, then the name will be **Account (JPY)** respectively.

* **Execution Delay** — the length of time between the acceptance of an order and its execution. In the real market, this parameter affects on the slippage. There are 3 options for the delay: *Range*, *Fix* and *None* (instant execution).

![General settings for symbols in Trading Simulator](https://blobscdn.gitbook.com/v0/b/gitbook-28427.appspot.com/o/assets%2F-LD6FsRvQ3jgwJIg6O7r%2F-LNEpO7sYUscptJoyiqt%2F-LNFC5cwVT1FecvTDve7%2Fsettings%20for%20symbols.png?alt=media\&token=08f429f8-8b2b-48da-a081-6721f3414dfd)

**Netting type** — methods by which to summarize existing and new positions. There are 3 types of nettings: **One Position**, **Multiple Per Side**, **Multiple Positions**. Examples of using each method you can find in the description of the [History Player panel settings](/trading-panels/history-player).


# Market depth

## General info <a href="#general-info" id="general-info"></a>

The Market Depth panel allows view the number of opening buy and sell orders at different price levels for a selected trading instrument. Thanks to this panel you can better understand the current market liquidity and determine where the supply and demand levels are.

![General view of Market Depth](https://content.gitbook.com/content/urdqk4sHwHHpr4J3s5P6/blobs/OhTrnePxtidaN9bLZxPF/Market%20Depth%20in%20action.gif)

## Main parts of MD panel <a href="#main-parts-of-md-panel" id="main-parts-of-md-panel"></a>

Market Depth panel consists of the following parts:

![](https://content.gitbook.com/content/urdqk4sHwHHpr4J3s5P6/blobs/XiOJqxl5QjnFfuTwrVOn/Parts%20of%20MD%20panel.png)

1. **Order Entry** where you can set the order quantity and other parameters before placing it.
2. **Level 1 bar** shows market data for the selected instrument for the current trading session.
3. **Position bar** displays a brief information about opened positions (average open price, quantity and current P/L)
4. **Additional columns** that can be activated to display the extended market data.

## Trading with Market Depth <a href="#trading-with-market-depth" id="trading-with-market-depth"></a>

Market depth panel gives you the ability to quickly and safely enter orders for an instrument with a single click. Using the order entry to configure an order in MD, you can select an account, order quantity, TIF and place an order by market or by Ask/Bid quote.

To enter an order in MD:

* Select an account and order restriction (TIF) in the order entry;
* Enter an order quantity;
* Click on the Bid, Ask or Market button to place your order;
* Confirm your placement by first checking all the parameters.

## Market Depth settings <a href="#market-depth-settings" id="market-depth-settings"></a>

Additional settings of the market depth allow you to customize the appearance of the panel, set the custom name of the panel, and also set the color schemes of the table.

### View settings <a href="#view-settings" id="view-settings"></a>

![View settings in market depth panel](https://content.gitbook.com/content/urdqk4sHwHHpr4J3s5P6/blobs/o35yejoVws0zfwjSZ03O/View%20settings%20in%20MD.png)

* **Aggregate size by price.** Allows to merge Bid size and Ask size by the same price that came from different ECNs (BATS, ARCA, IEX etc.);
* **Show order entry.** This option shows/hides an Order Entry on the panel for quick order placement;
* **Show toolbar.** This option shows/hides the top toolbar with the trading symbol and expands the "useful" area of the panel. It is recommended to use this option with the symbol link;
* **Show Level 1.** Shows/hides the header pane, which contains Level 1 market data for the selected instrument.

### Coloring settings <a href="#coloring-settings" id="coloring-settings"></a>

The Market depth panel has different coloring methods for Level 2 quotes which allow you to adjust the colors according to the specified conditions.

![Coloring methods in market depth](https://content.gitbook.com/content/urdqk4sHwHHpr4J3s5P6/blobs/Re2xO0K6ZjLbfGxMAT47/Coloring%20methods%20MD.gif)

At the bottom of the Market Depth is the Position Bar, which displays a brief info about an open position on the current trading instrument — the number of contracts, the average open price, current profit and loss.

### Position bar settings <a href="#position-bar-settings" id="position-bar-settings"></a>

* **By price level.** Coloring system by color levels depending on price tier;
* **Relative to volume.** Level 2 quotes are colored on the assumption that the max volume has the most saturated color;
* **Step to max volume.** Level 2 quotes are colored on the assumption that the max volume value which is set in the settings has the most saturated color. Here you can set Max volume value and pick the most saturated Ask and Bid colors.

![Position bar settings in market depth panel](https://content.gitbook.com/content/urdqk4sHwHHpr4J3s5P6/blobs/PnA2qGKU4EdhQyDyxRpU/Position%20bar%20settings.png)


# Copy Trading

The "Copy trading" panel allows you to duplicate all your trading activities among multiple accounts (Parent & Child) within one exchange or broker.

One of the frequent questions from our community is: how to Copy trading between multiple accounts? Such functionality can be very useful for proprietary trading companies and managers with multiple accounts who use 3rd Dimension as their trading tool.

## **Introduction**

The panel performs trading operations and thus can be found in the "<mark style="background-color:green;">**Trading**</mark>" group of the 3rd Dimension main menu.

<figure><img src="https://content.gitbook.com/content/urdqk4sHwHHpr4J3s5P6/blobs/uKD252qlS2W35qwFE2hx/copy%20trading.png" alt=""><figcaption><p>Copy trading panel in a list of other panels</p></figcaption></figure>

Copy trading panel allows you to fully duplicate trading activity between multiple accounts of the same connection. Unlike the “Multiple order” panel, this panel will automatically copy all Parent's account transactions into the specified Child account(s) once you have created and launched a special algorithm (Bot).

{% hint style="info" %}

Before you start creating your first Copy-bot, please notice the following information:

* Copy-trading can work only if the 3rd Dimension terminal is launched.
* If the dependent connections (parent & child) are NOT ACTIVE, the Bot will copy orders for active connections only and ignore disconnected.
* If Parent order parameters are different than a Child account can submit, you will get a notification about this and the possibility to manually copy the order by clicking the **Open OE button** next to this message in the logs section. The most common cause of such behavior is when the Child account has insufficient funds to copy the parent's order quantity.
* The Copy trading panel currently supports the following connections only: **Binance, Binance Futures, Bitfinex, Bybit, BitMEX, and Interactive Brokers**
  {% endhint %}

{% hint style="warning" %}
**If you use 5 or more trading accounts** in the copy bot, we recommend disabling the '<mark style="background-color:orange;">**Order Limitation**</mark>' option. You can read more information about this feature in [**this guide**](/general-settings/general-settings#trading-protection)**.**
{% endhint %}

## Create a Copy-bot

Once you open a Copy trading panel, you will find the Bots management screen, divided into “Bots list” and “Logs”. Let’s create a new copy trading bot. To do this, click on the Plus button on the panel’s toolbar, and you will see the “New copy trading bot” screen appear.

<figure><img src="https://content.gitbook.com/content/urdqk4sHwHHpr4J3s5P6/blobs/JjRx45XLFccbeLPcaYf9/image.png" alt=""><figcaption><p>New copy bot creation screen</p></figcaption></figure>

Here you should name your bot and specify Parent connection (account) to set up where to copy trades from. Now we should add dependent connections by pressing the Plus button next to the “Child connections” label. Each new item line in the following table represents a Child connection that will copy all trading activities from the Parent.&#x20;

### Add multi accounts for the same connect&#xD;

Now we should specify the dependent connection and account. To add another account for the same connection in 3rd Dimension, you should go to Connections manager, duplicate the required connection, rename it optionally, and log in with another account credentials. You may repeat this action for as many accounts as you need. Later you will see all these accounts in Child connections settings.

<figure><img src="https://content.gitbook.com/content/urdqk4sHwHHpr4J3s5P6/blobs/znKtMjK5ki3TqKiNRSWo/image.png" alt=""><figcaption></figcaption></figure>

### Copy-trading mods&#xD;

The quantity copy mode option tells the bot how to calculate the quantity for copied order relative to the Parent order. There are two options: Percentage and Multiplier.

In a **Percentage mode**, the bot will calculate the quantity relative to the Parent account balance in percent and then apply this percentage to the Child account balance to set the Copy order quantity.

{% hint style="success" %}
**Percentage Example:** Parent account has a balance of $1000. The Child account has a balance of $2000. When you place an order on the parent account equal to $100 (10% of the total balance), an order will be placed automatically on the child account for 10% of its total balance, or 200$.
{% endhint %}

In a **Multiplier mode**, the bot will take a quantity from the Parent order and multiply it with the Multiplier coefficient, thus getting a quantity value for a Child copy order.

{% hint style="success" %}
**Multiplier Example:** The parent account has an order of $100, and the Bot is set up with Multiplier Coefficient (C)=0.5. Once you place the order on the parental account, the order will be copied to the child account considering C=0.5, i.e. $100 \* 0.5 = $50
{% endhint %}

Once we set up all of the Bot settings, click the Save button. Now we see that the new Copy trading bot appeared in the Bots list section.

Copy-Bots management

Once created, any Bot is stopped and not monitoring Parent’s trading activities. To activate it, click the Start button. Now it is Working and ready to copy your orders to Child accounts.

<figure><img src="https://content.gitbook.com/content/urdqk4sHwHHpr4J3s5P6/blobs/k9NQO3LiXlSxuU3OKYLd/image.png" alt=""><figcaption></figcaption></figure>

Bot management table contains the following information and controls:

* **Bot name.** Each bot can be given its unique name;
* **Parent account.** Account to copy trades from;
* **Child account.** Account to copy trades to;
* **Status.** Bot's current status. Can be "Working" or "Stopped";
* **Action.** Button to start/stop bots;
* **Settings.** This "gear" icon opens settings of the selected trading bot;
* **Delete.** Removes the trading bot.

Visual control

You can visually observe the complete synchronization of trades by opening two charts at the same time. Just after you send an order, the Bot will copy it to a Child account. If you modify your order — the Child account order will be modified also. Canceled orders will be canceled for the dependent account also. By the way, Stop Loss and Take profit orders for our position are also successfully mirroring to the dependent account.

<figure><img src="https://content.gitbook.com/content/urdqk4sHwHHpr4J3s5P6/blobs/EjXX33s00lglavf8VpvL/1211.jpg" alt=""><figcaption></figcaption></figure>

All actions of activated Bots will be shown in a Logs list at the panel’s bottom, including information about "start" & "stop" time, and all of the copy-trading activities. You can even change the logs period on the toolbar above the Logs table.


# Market Replay

Market Replay (or History Player) allows you to test strategies on any trading instruments with any data provider or broker

[**First launch of the Market Replay**](#first-launch-of-the-market-replay)\
[**General and instruments settings**](#general-and-instruments-settings)

### What is Market Replay

Testing of trading strategies is one of the most important and necessary steps for successful trading. If you are an experienced algotrader, then the automatic testing method is ideal and you can use our Extension for Visual Studio. But unfortunately, many traders don't know the programming language, which makes testing their strategies difficult.

Therefore 3rd Dimension provides the **Market Replay panel** for simple manual backtesting of any trading strategy.

<figure><img src="https://content.gitbook.com/content/urdqk4sHwHHpr4J3s5P6/blobs/4YCk6ODXsTGw7mjf3qAj/market%20rep1.jpg" alt=""><figcaption><p>Testing process with Market Replay panel</p></figcaption></figure>

Market Replay allows you to test on any trading instruments with any vendor or broker. This is especially useful when you have access to the data feed that does not allow execution of orders (quotation date feeds like crypto exchange).

### First launch of the Market Replay

* Start the panel from the main application menu
* Add a trading instrument for testing
* Set the data type  — Tick, 1 minute, 1 day
* Set the execution type  — Last or Bid/Ask/Last
* Click on the "Start" button to start testing

<figure><img src="https://content.gitbook.com/content/urdqk4sHwHHpr4J3s5P6/blobs/swub7ms1YbmAJDCT2ekw/market%20replay.png" alt=""><figcaption><p>Launch Market Replay panel</p></figcaption></figure>

<figure><img src="https://content.gitbook.com/content/urdqk4sHwHHpr4J3s5P6/blobs/HjktIpPayXemRIZnJbpd/image.png" alt=""><figcaption><p>General view of Market Replay with main settings</p></figcaption></figure>

{% hint style="warning" %}
If you click on the "**Stop"** button, all test progress will be canceled.
{% endhint %}

When the testing is started you can open all the necessary panels for testing by clicking on the “Open panel” button.

<figure><img src="https://content.gitbook.com/content/urdqk4sHwHHpr4J3s5P6/blobs/k5fwpaOKqbmwLJai9eLk/Market%20replay%20in%20action.gif" alt=""><figcaption><p>Open necessary panels to create a workspace for backtesting</p></figcaption></figure>

### General and instruments settings

Before you start testing the strategy, you need to set up an initial trading balance, a simulation (or modeling) scheme for downloaded data, a commission size for a trading instrument, and the netting type.

<figure><img src="https://content.gitbook.com/content/urdqk4sHwHHpr4J3s5P6/blobs/gV4z4E4XjA6GRgilYUIe/image.png" alt=""><figcaption><p>Set up the initial trading balance and modeling scheme</p></figcaption></figure>

Strategy testing can be performed by one of three schemes to choose from:

* **OHLC** - in this mode the sequence is constructed only by the OHLC prices of the minute bars, the number of the generated control points is significantly reduced - hence, so is the testing time.
* **Open** - in this mode, all trades are opened at the opening price of the next bar. This mode is well suited for testing strategies, which process deals only at the opening of the bar and do not use pending orders, as well as StopLoss and TakeProfit orders.
* **Close** - in this mode, all trades are opened at the closing price of the current bar.

{% hint style="info" %}
"Open" and “Close” modes have the fastest testing time, but they are not suitable for all of the trading strategies. Select the desired test mode based on the characteristics of the trading system.
{% endhint %}

Now let's look at the main settings of the selected trading instrument

<figure><img src="https://content.gitbook.com/content/urdqk4sHwHHpr4J3s5P6/blobs/YYUb6L80c2I9Z5wLFyjB/image.png" alt=""><figcaption><p>Basic settings for trading instrument — Netting type and Additional Fees</p></figcaption></figure>

In the **Netting type** section, you can choose the method by which to summarize existing and new positions:

* **One position** - it is possible to open one position for one instrument in one direction in this mode. If you previously opened a position to buy 1 lot, adding a position to sell 1 lot will close the previous position. New trades for buy will be summed by volume, and the entry price will be averaged.

<figure><img src="https://content.gitbook.com/content/urdqk4sHwHHpr4J3s5P6/blobs/15K88YzigjsF0JtefDME/orders-matching-mode-one-position.gif" alt=""><figcaption><p>Positions are overlapped by the netting type called "One Position"</p></figcaption></figure>

**Multiple per Side** - this mode allows you to open many different positions in one direction.  For example, opening several positions in the sequence, they will be opened separately. Opposite trades (for sale) will close them.

<figure><img src="https://content.gitbook.com/content/urdqk4sHwHHpr4J3s5P6/blobs/qYM2k0acpICVGr04igHE/orders-matching-mode-multiple-per-side.gif" alt=""><figcaption><p>Positions are overlapped by the netting type called "Multiple Per Side"</p></figcaption></figure>

**Multiple Positions** - each new trade will be opened as a separate item, including the opposite trades.

<figure><img src="https://content.gitbook.com/content/urdqk4sHwHHpr4J3s5P6/blobs/d8cD6wSnCT4AlfHbw6Iu/orders-matching-mode-multiple-positions.gif" alt=""><figcaption><p>Positions are overlapped by the netting type called "Multiple Position"</p></figcaption></figure>


---

[Next Page](/llms-full.txt/1)